Task Teacher Guide
Be sure to read the teacher guide prior to running the task. When you’re ready to run the task, use the tabs at the top of the page to navigate through the lesson.
[accordion openall=”false” clicktoclose=”true” state=”closed” autoclose=”false” openfirst=”true” clicktoclose=”true”]
[accordion-item title=”Through This Assessment Opportunity…”]
Students will demonstrate the concepts and skills that they have developed through this context and learning experience.
[/accordion-item]
[accordion-item title=”Intentionality…”]
The purpose of this assessment is for students to demonstrate their understanding of the following big ideas.
- Frequency is the number of times a category or event occurs within a data set.
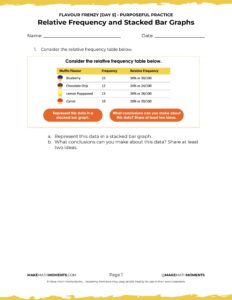
- A relative frequency table shows each category expressed as a fraction of the total quantity or frequency.
- Relative frequency can be represented using fractions, decimals, or percents.
- Fractions, decimals, and percents can all represent relationships to a whole.
- The sum of the relative frequencies is 1 or 100%.
- Stacked-bar graphs display the data proportionally, relative to the whole.
- Stacked-bar graphs relative frequency.
- Each bar in the graph represents a whole, and each of the segments in a bar represents a different category.
- Different colours are used within each bar to represent each category.
The independent assessment will allow students to demonstrate concepts and skills related to the following learning goals:
- I will determine the relative frequency of a category within a data set.
- I will interpret and draw conclusions based on data presented in a relative frequency table and stacked bar graph.
- I will communicate sample data sets that could be represented using a stacked bar graph.
- I will demonstrate an understanding of the relationship between fractions and percent.
- I will create stacked bar graphs based on a data set with appropriate labels.
Students might write and/or model their task independently. Students can also be interviewed by their teacher.
An alternative assessment opportunity should be offered if this tool will not successfully capture what the student knows, understands or can do.
[/accordion-item]
[/accordion]
Math Talk
[accordion openall=”false” clicktoclose=”true” state=”closed” autoclose=”false” openfirst=”false” clicktoclose=”true”]
[accordion-item title=”String of Related Problems”]
Login/Join to access the entire Teacher Guide, downloadable slide decks and printable handouts for this lesson and all problem based units.
[/accordion-item]
[accordion-item title=”Assessment Considerations…”]
Login/Join to access the entire Teacher Guide, downloadable slide decks and printable handouts for this lesson and all problem based units.
[/accordion-item]
[accordion-item title=”Assessment: Relative Frequency and Stacked Bar Graphs”]
Login/Join to access the entire Teacher Guide, downloadable slide decks and printable handouts for this lesson and all problem based units.
[/accordion-item]
[accordion-item title=”Considerations to Promote Student Growth”]
Download Editable/Printable Handout
Become a member to access purposeful practice to display via your projector/TV, download the PDF to upload to your LMS and/or print for students to have a physical copy
[/accordion-item]
[/accordion]
Resources and Downloads
Lesson Tip Sheet
Download the lesson plan in PDF format so you can keep it handy and share with colleagues.
Videos & Images
 Download the videos, images, and related media files to your computer to avoid streaming.
Keynote Slides
 Download in Apple Keynote format to avoid streaming video and run the lesson smoothly.
PowerPoint Slides
 Download in Microsoft PowerPoint format to avoid streaming video and run the lesson smoothly.
Printable Handout
Download/Edit the handout so you can keep it handy and share with colleagues.
Explore The Entire Unit of Study
This Make Math Moments Task was designed to spark curiosity for a multi-day unit of study with built in purposeful practice, and extensions to elicit and emerge mathematical models and strategies.
Click the links at the top of this task to head to the other related lessons created for this unit of study.
[accordion openall=”false” clicktoclose=”true” state=”closed” autoclose=”false” openfirst=”true” clicktoclose=”true”]
[accordion-item title=”Math Talk Prompt #1″]
Login/Join to access the entire Teacher Guide, downloadable slide decks and printable handouts for this lesson and all problem based units.
[/accordion-item]
[/accordion]
[accordion openall=”false” clicktoclose=”true” state=”closed” autoclose=”false” openfirst=”true” clicktoclose=”true”]
[accordion-item title=”Question #1″]
Login/Join to access the entire Teacher Guide, downloadable slide decks and printable handouts for this lesson and all problem based units.
[/accordion-item]
[accordion-item title=”Question #2″]
Login/Join to access the entire Teacher Guide, downloadable slide decks and printable handouts for this lesson and all problem based units.
[/accordion-item]
[accordion-item title=”Question #3″]
Login/Join to access the entire Teacher Guide, downloadable slide decks and printable handouts for this lesson and all problem based units.
[/accordion-item]
[/accordion]
Download Editable/Printable Handout
Become a member to access purposeful practice to display via your projector/TV, download the PDF to upload to your LMS and/or print for students to have a physical copy