What Do You Notice? What Do You Wonder?
Show students the following video:
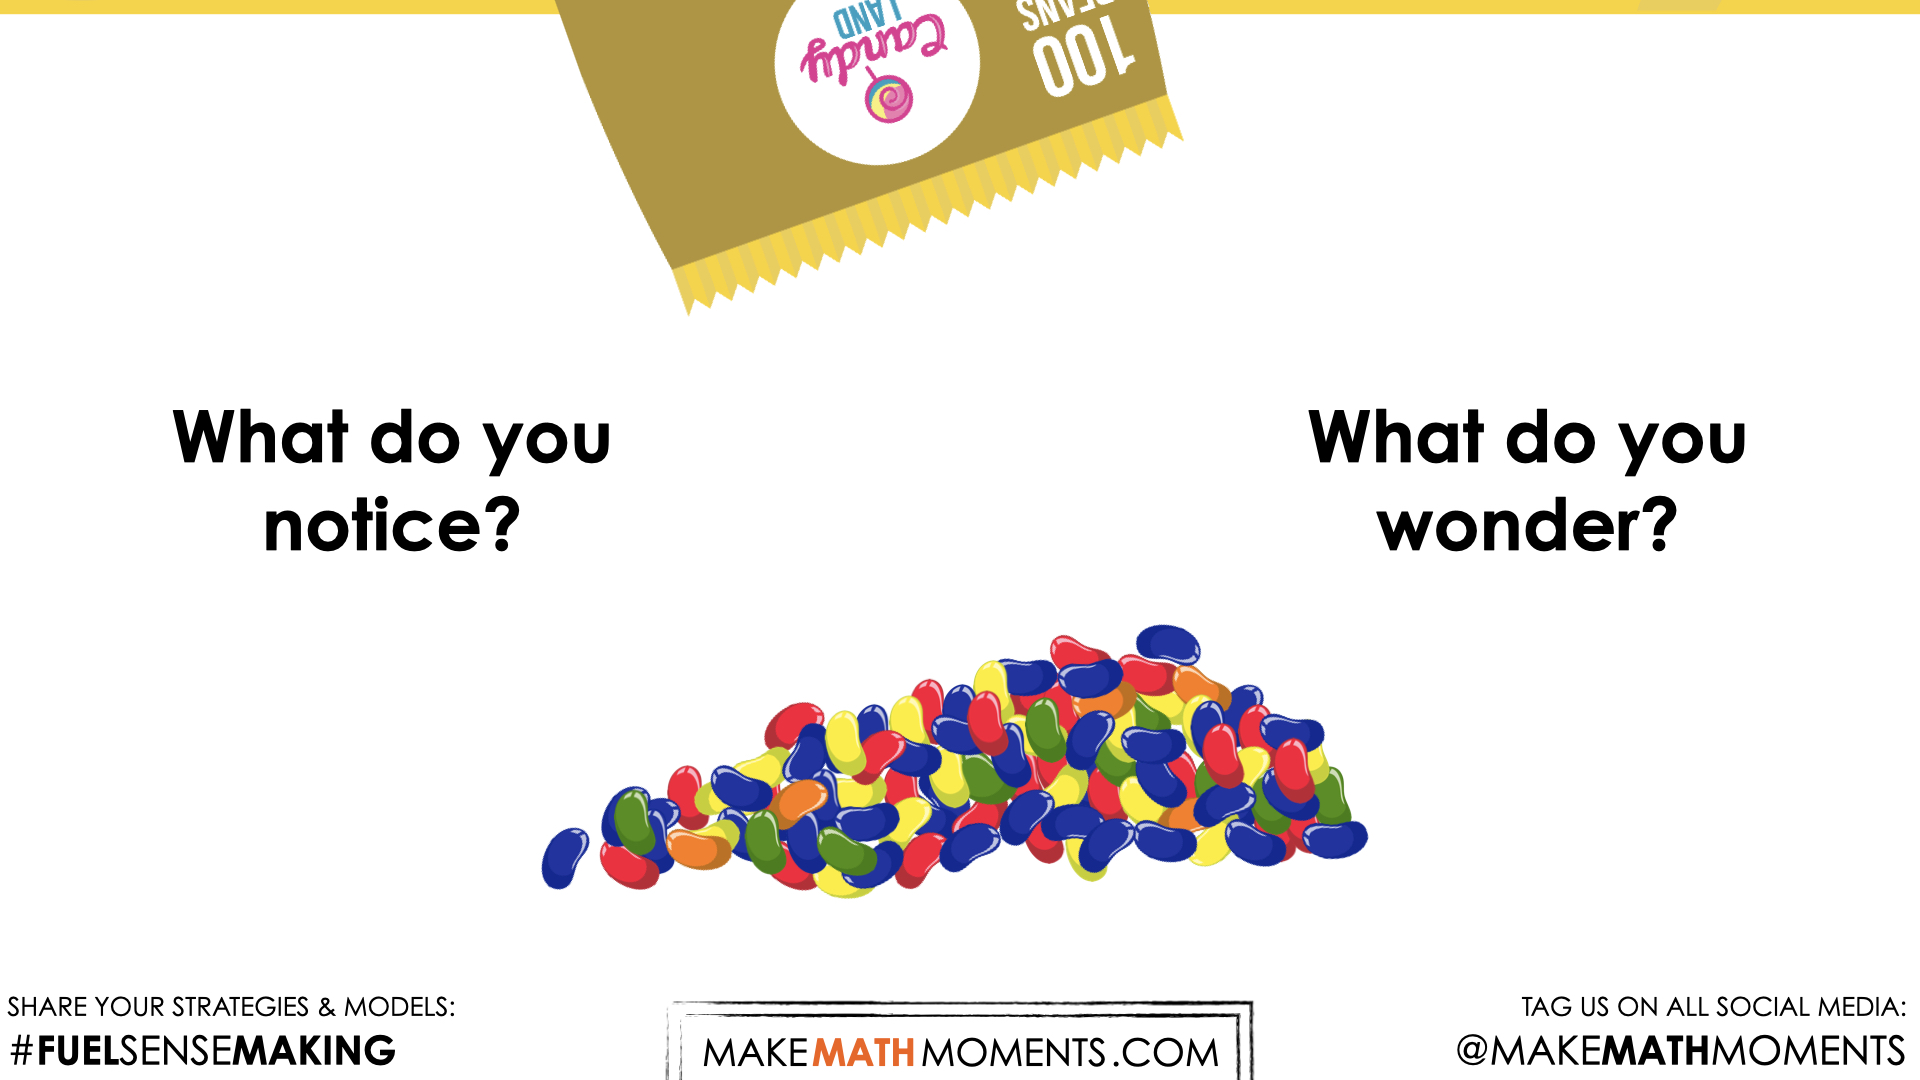
Then, ask students:
What do you notice?
What do you wonder?
Give students 60 seconds (or more) to do a rapid write on a piece of paper.
Then, ask students to share with their neighbours for another 60 seconds.
Finally, allow students to share with the entire group.
Some of the noticing and wondering that came up in a class recently included:
- I notice a bag of jelly beans.
- I notice there are a lot of jelly beans.
- I notice different colours.
- I wonder what flavour they are.
- I wonder how many there are of each colour.
- I notice that there are more blue jelly beans than any other colour.
At this point, you can answer any notices and wonders that you can cross off the list right away.
Estimation: Prompt
Next, share the following short animation or visual prompt and ask the following question:
The red jelly beans make up what fraction of the entire bag of jelly beans?
Without counting, make an estimate.
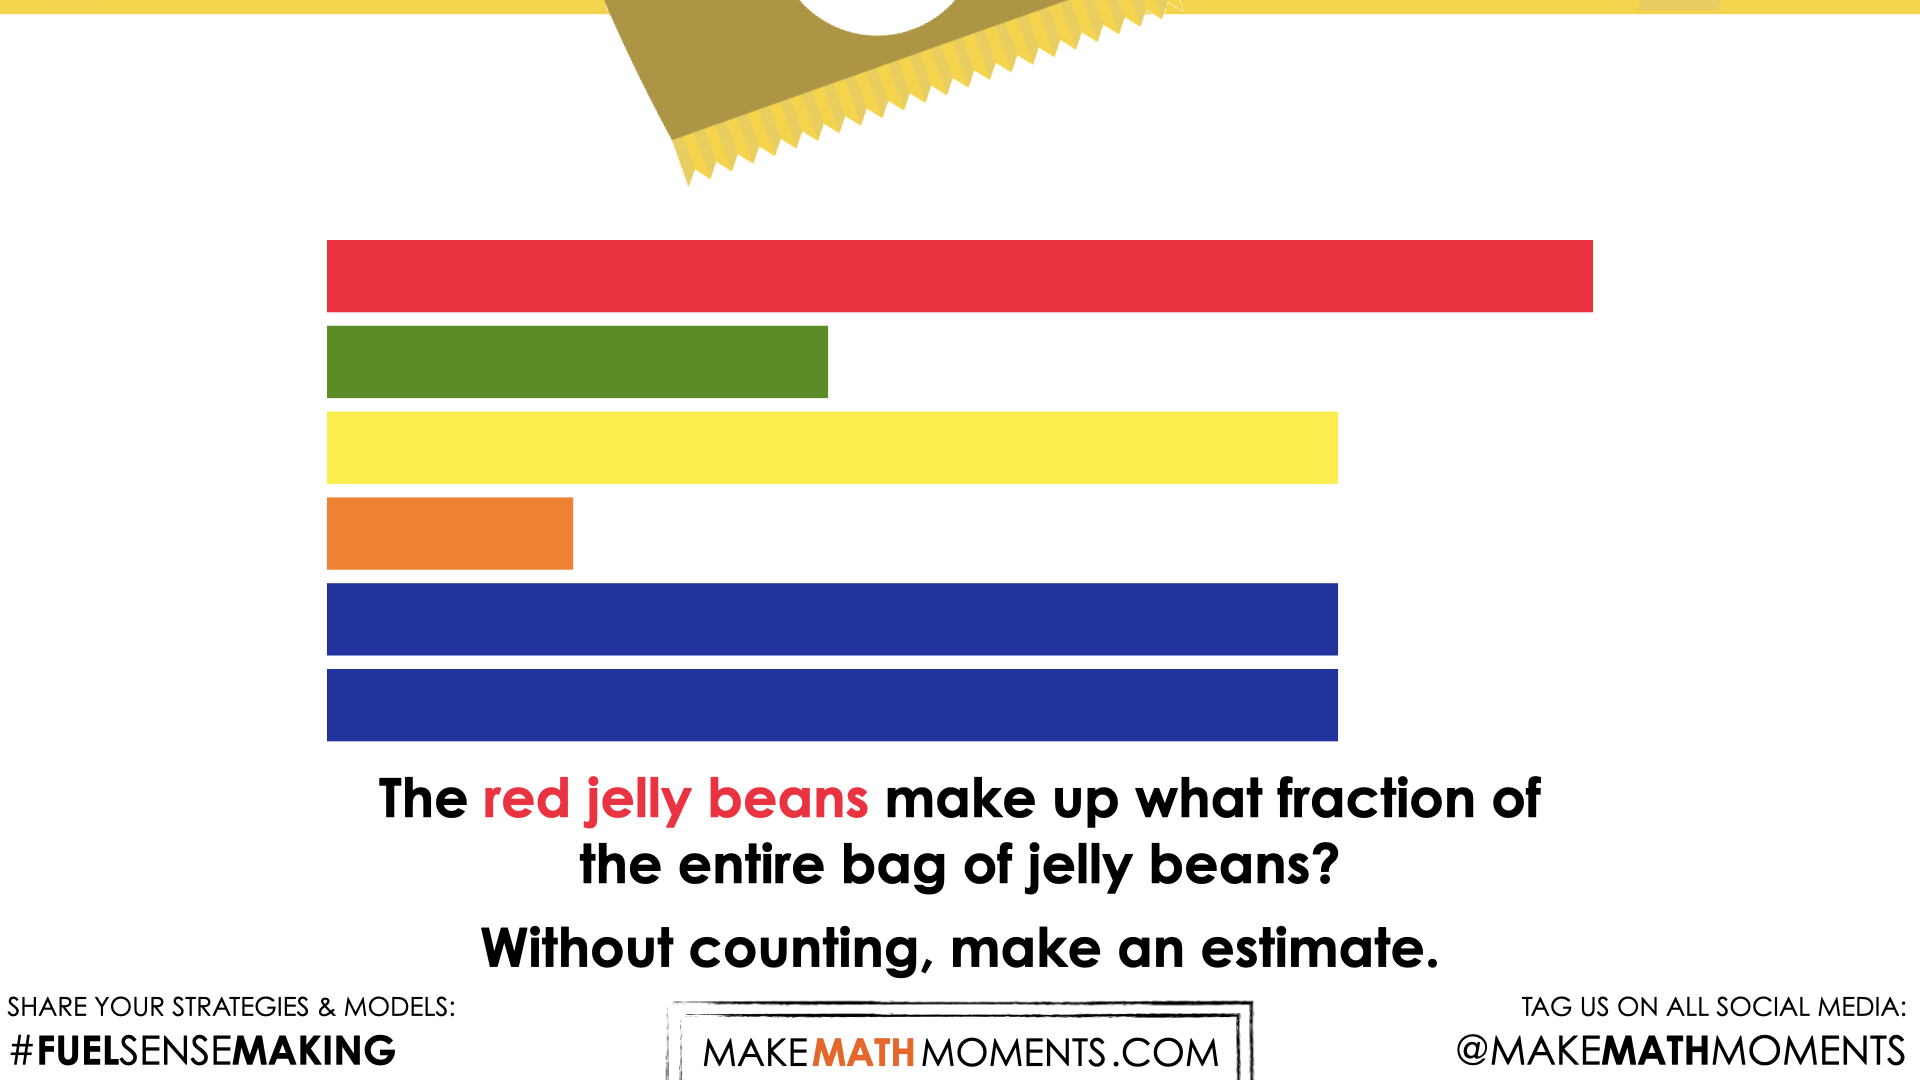
We can now ask students to make an estimate (not a guess) as we want them to be as strategic as they can possibly be. This will force them to use reasoning to try and come up with a reasonable fraction.
While Students Are Estimating…
Monitor student thinking by circulating around the room and listening to the mathematical discourse. Encourage students to use precise mathematical language and listen for the use of both fractional language and percent to describe the quantity of red jelly beans relative to the whole. Some students will likely communicate the fractional amount out of 100 jelly beans. Others may determine that red represents one fourth of the bag. This is an opportunity to discuss equivalence.
Allow students to share their estimates with neighbours first, then with the class. Write down their estimates on the chalkboard/whiteboard/chart paper so students feel their voices are being heard and so they feel they have a stake in solving this problem.
Estimation: Reveal
Share the following animation.
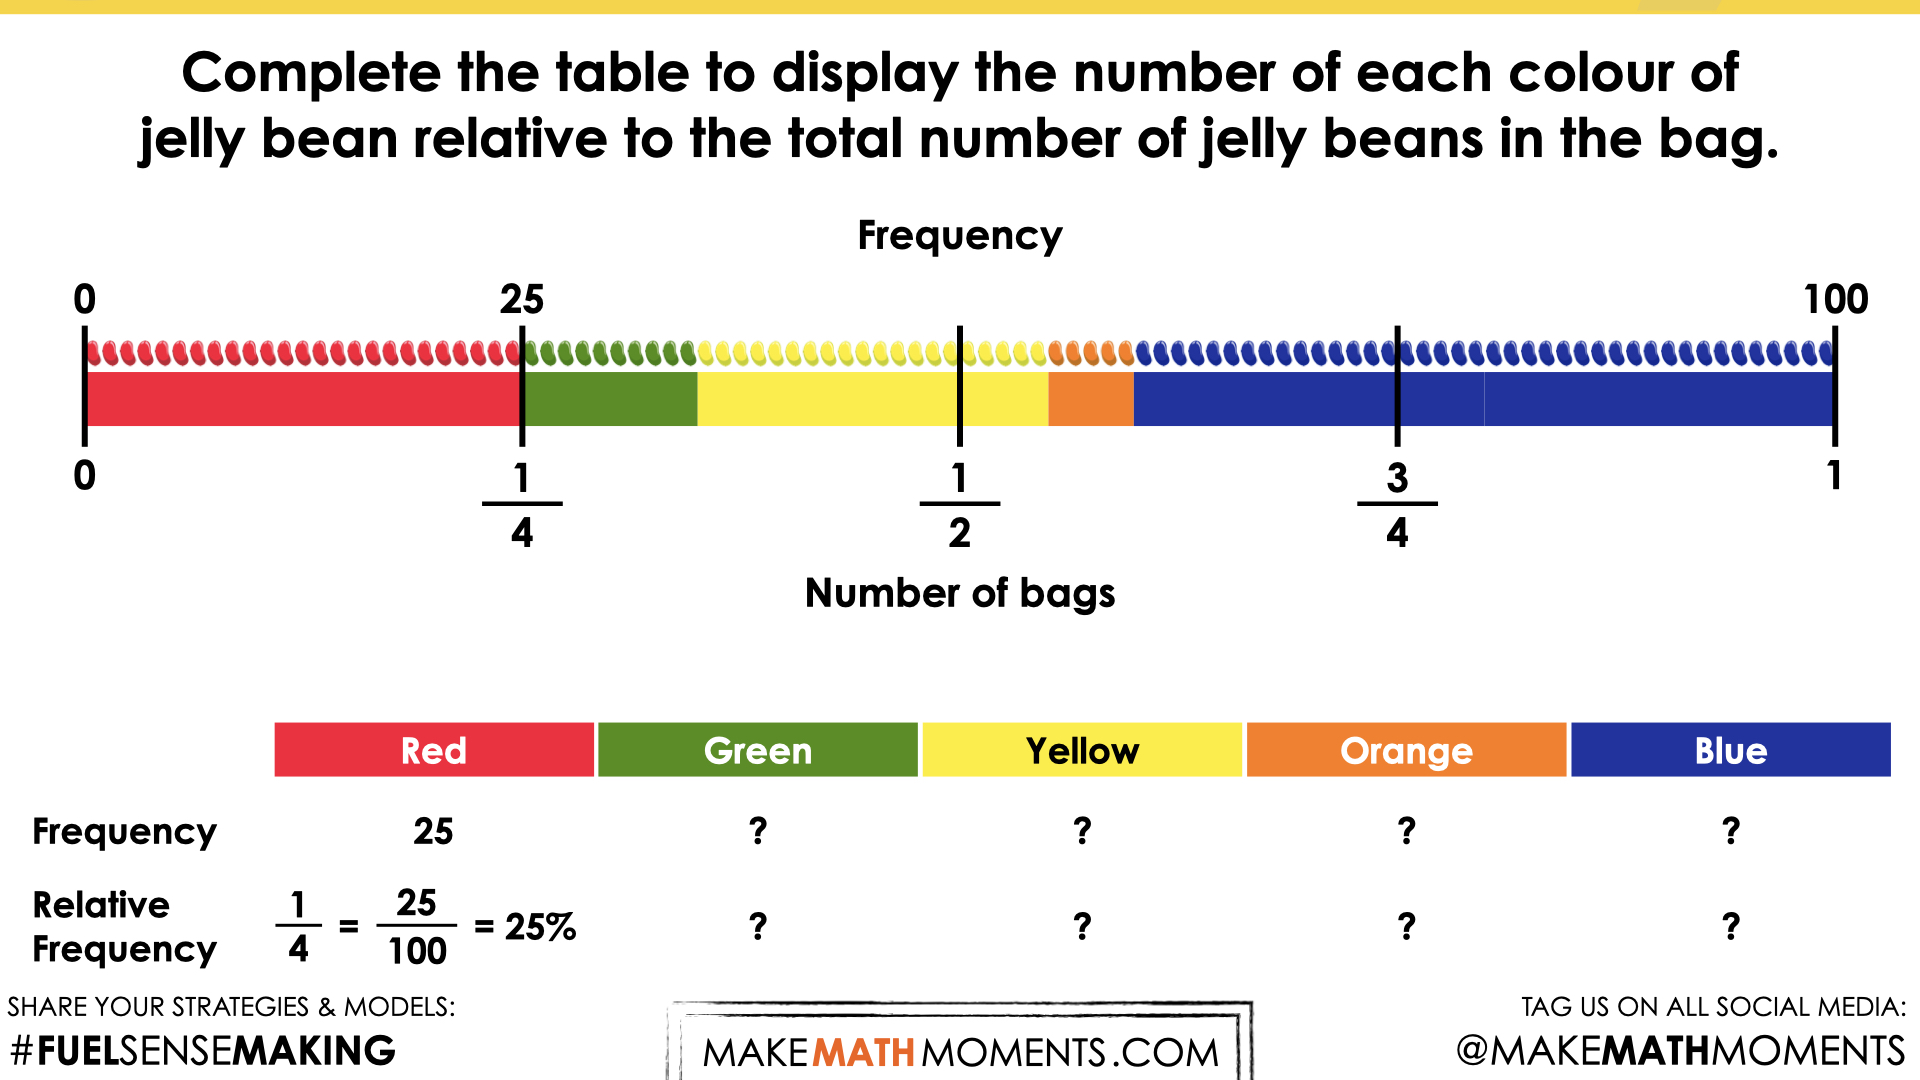
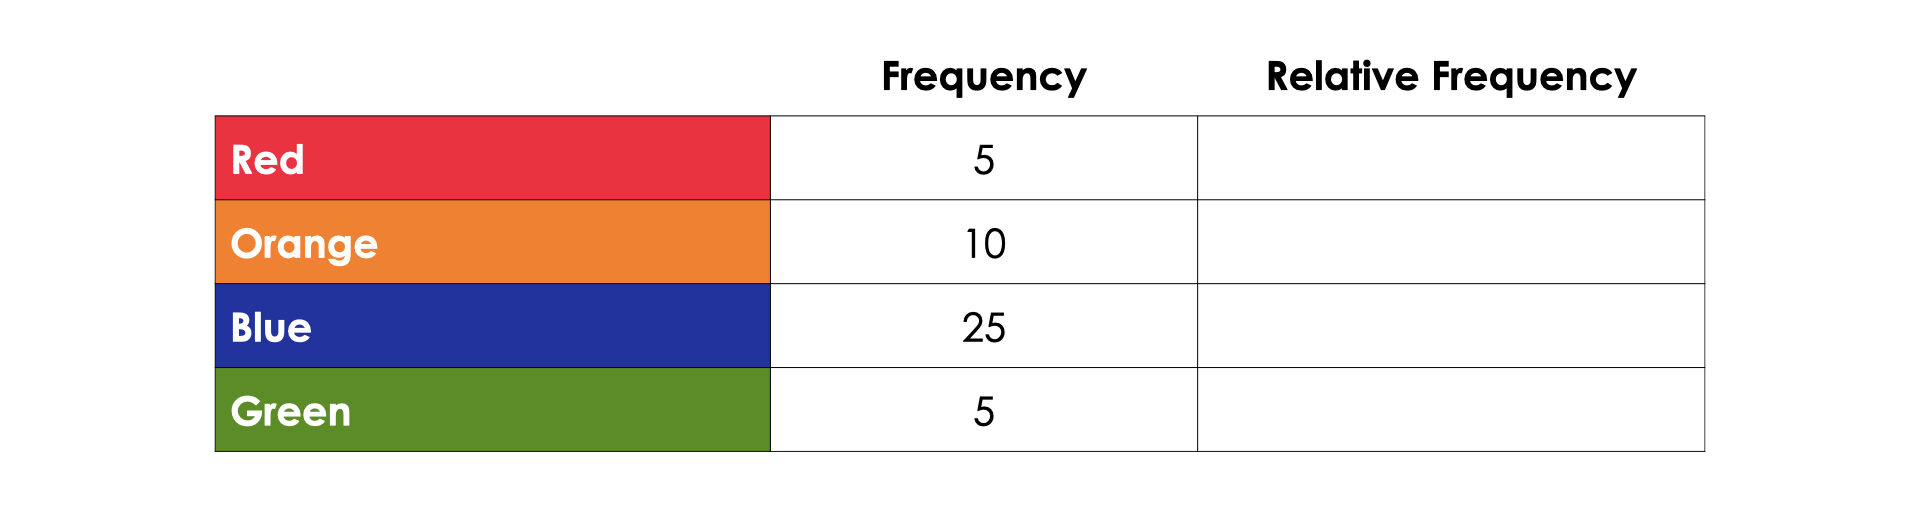
Discuss the information shared in this relative frequency table about the red jelly beans. Relative to all 100 jelly beans in the bag, red makes up one-fourth of the bag, or 25% of the 100 jellybeans in the bag. When determining relative frequency, it is helpful to think of the whole as 100. Luckily in this scenario, there are 100 jelly beans in the bag.
Encourage students to discuss how they would complete the table for the other colours in the bag.
Crafting A Productive Struggle:
Since you have already taken some time to set the context for this problem and student curiosity is already sparked, we have them in a perfect spot to help push their thinking further and fuel sense making.
Share the following silent animation.
You can verbally share the following prompt with students:
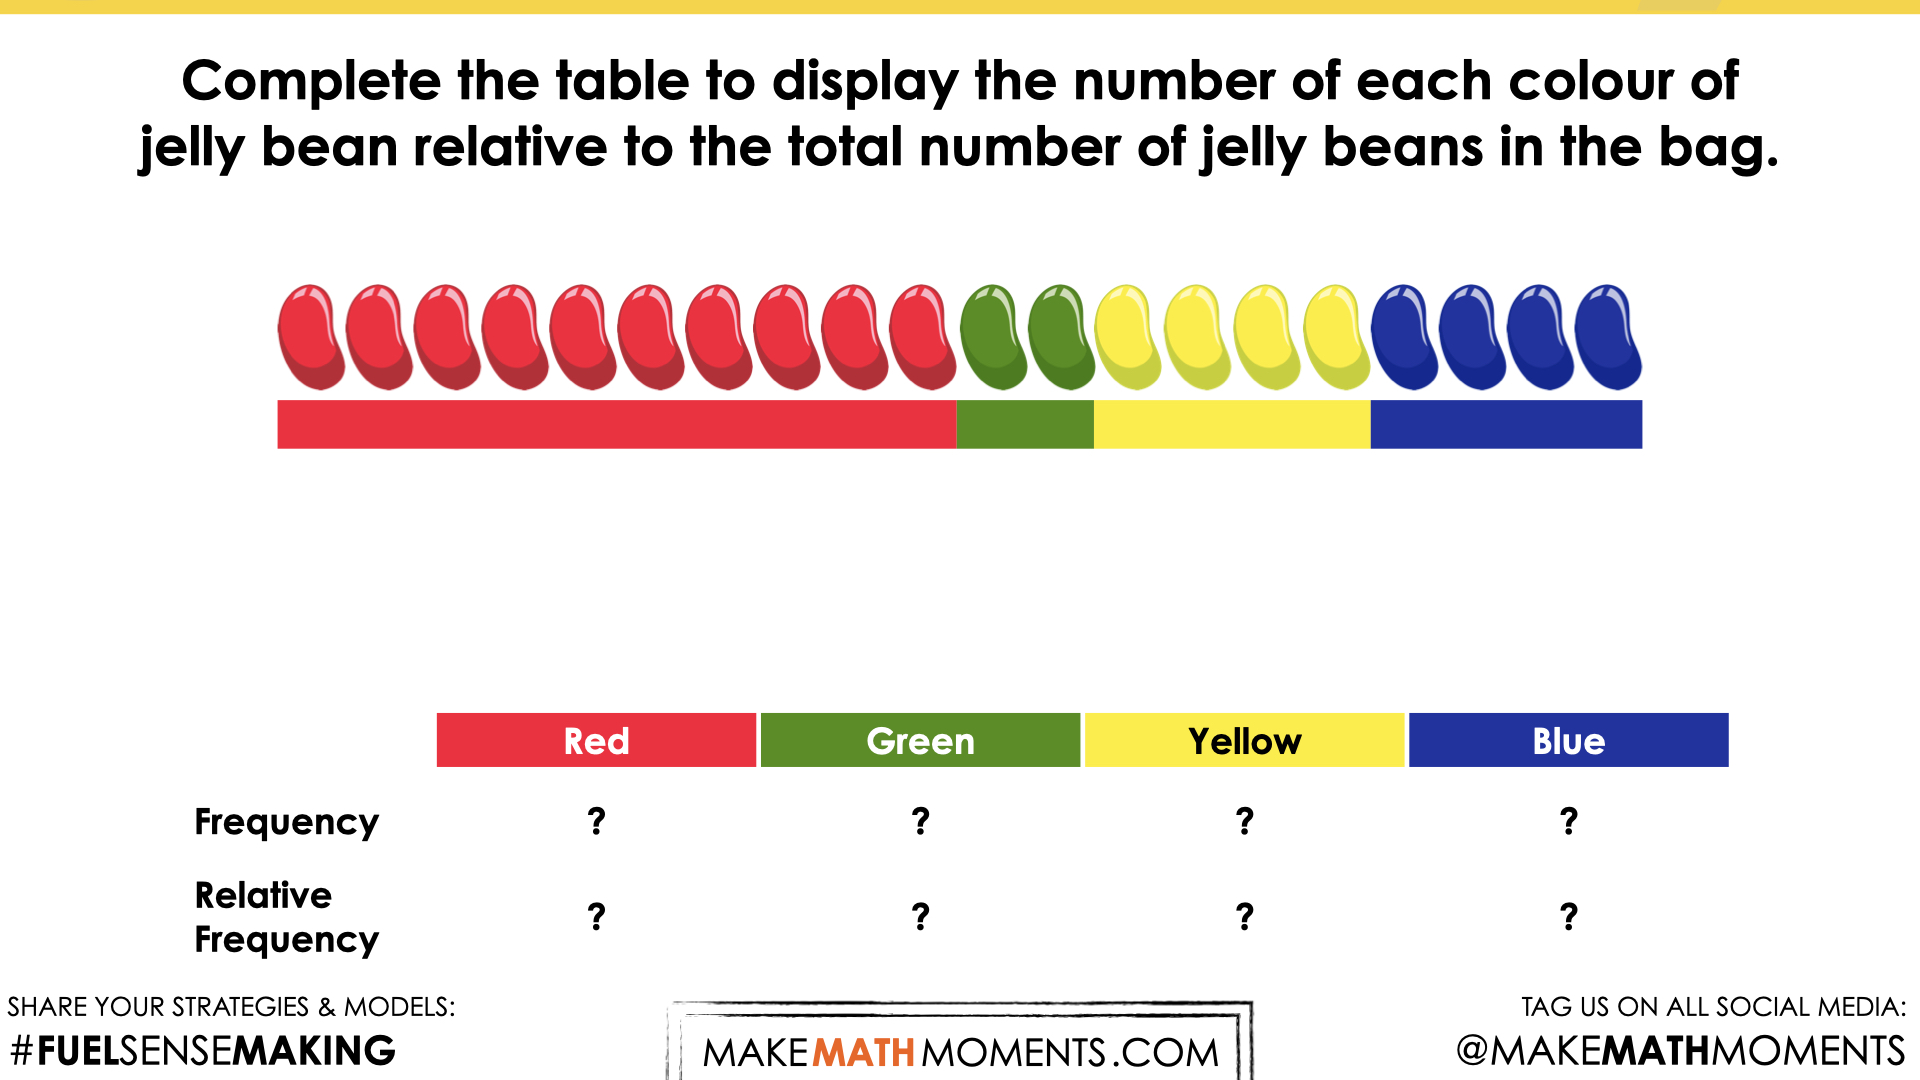
Complete the table to display the number of each colour of jelly bean relative to the total number of jelly beans in the bag.
Student Approach #1: Counting On
![Flavour Frenzy [Day 1]](https://learn.makemathmoments.com/wp-content/uploads/2022/06/Flavour-Frenzy-Day-1-Sorting-Jelly-Beans-09-Student-Approach-1-e1654208931812.jpeg)
I put all the jelly beans in a row, organized by colour. Then I put each of the colours below to see how many jelly beans there were compared to the whole. I noticed that red was half of the row. For yellow and blue, I realized I needed 5 copies to make one whole bag. So that means that one group of 4 is only one-fifth of the bag. The green is two jelly beans, I would need 10 copies of two to make one whole bag, so that means the green is one-tenth of the bag.
Student Approach #2: Skip Counting
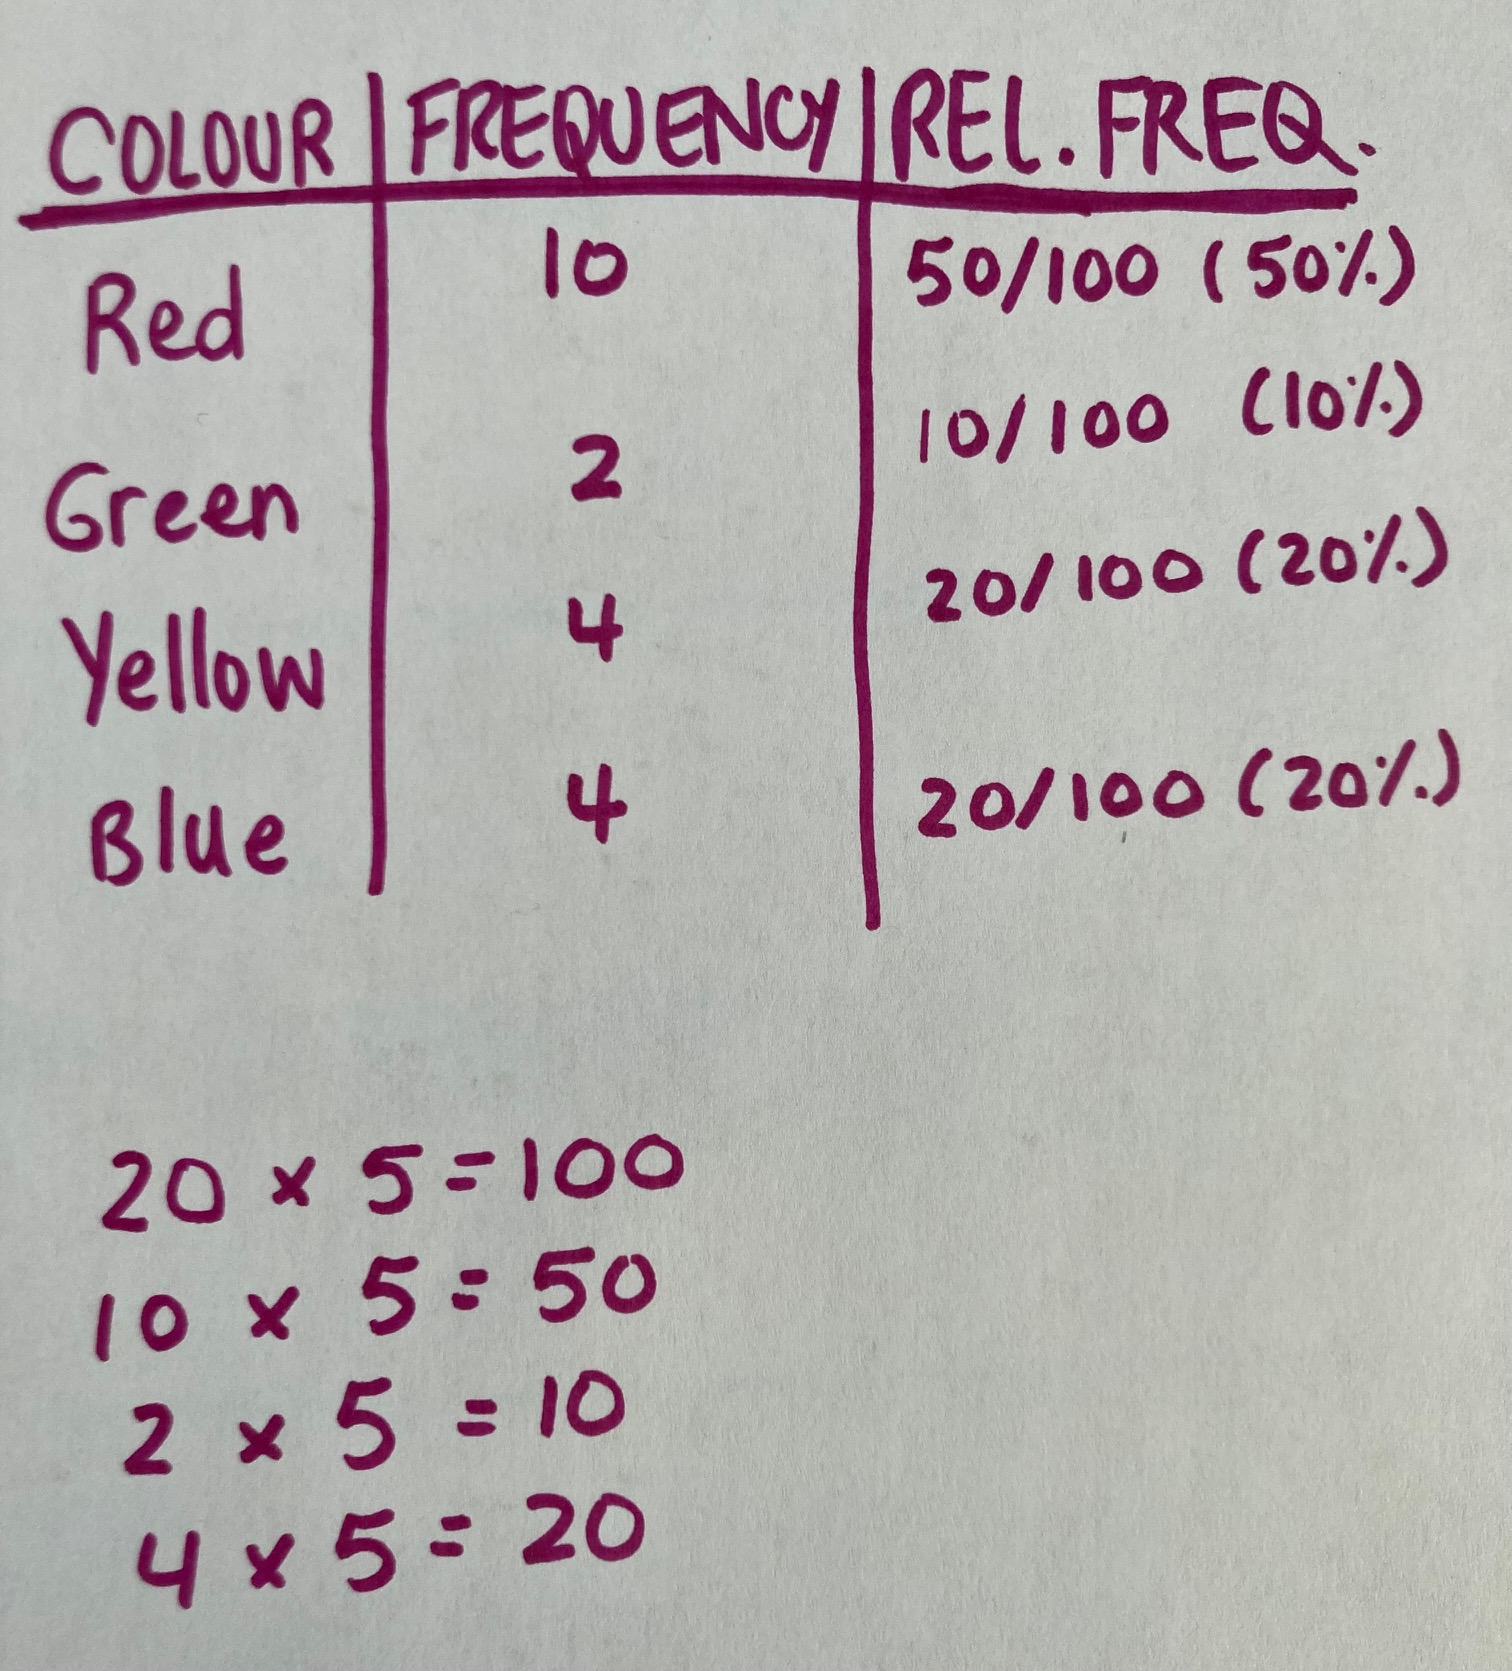
This bag has 20 jelly beans. I wanted to imagine how many of each colour there would be if the bag had 100. Because twenty multiplied by 5 is 100, I multiplied all the colours by 5. This gave me a fraction out of 100, which I can also show as a percent.
Student Approach #3: Multiplication & Doubling
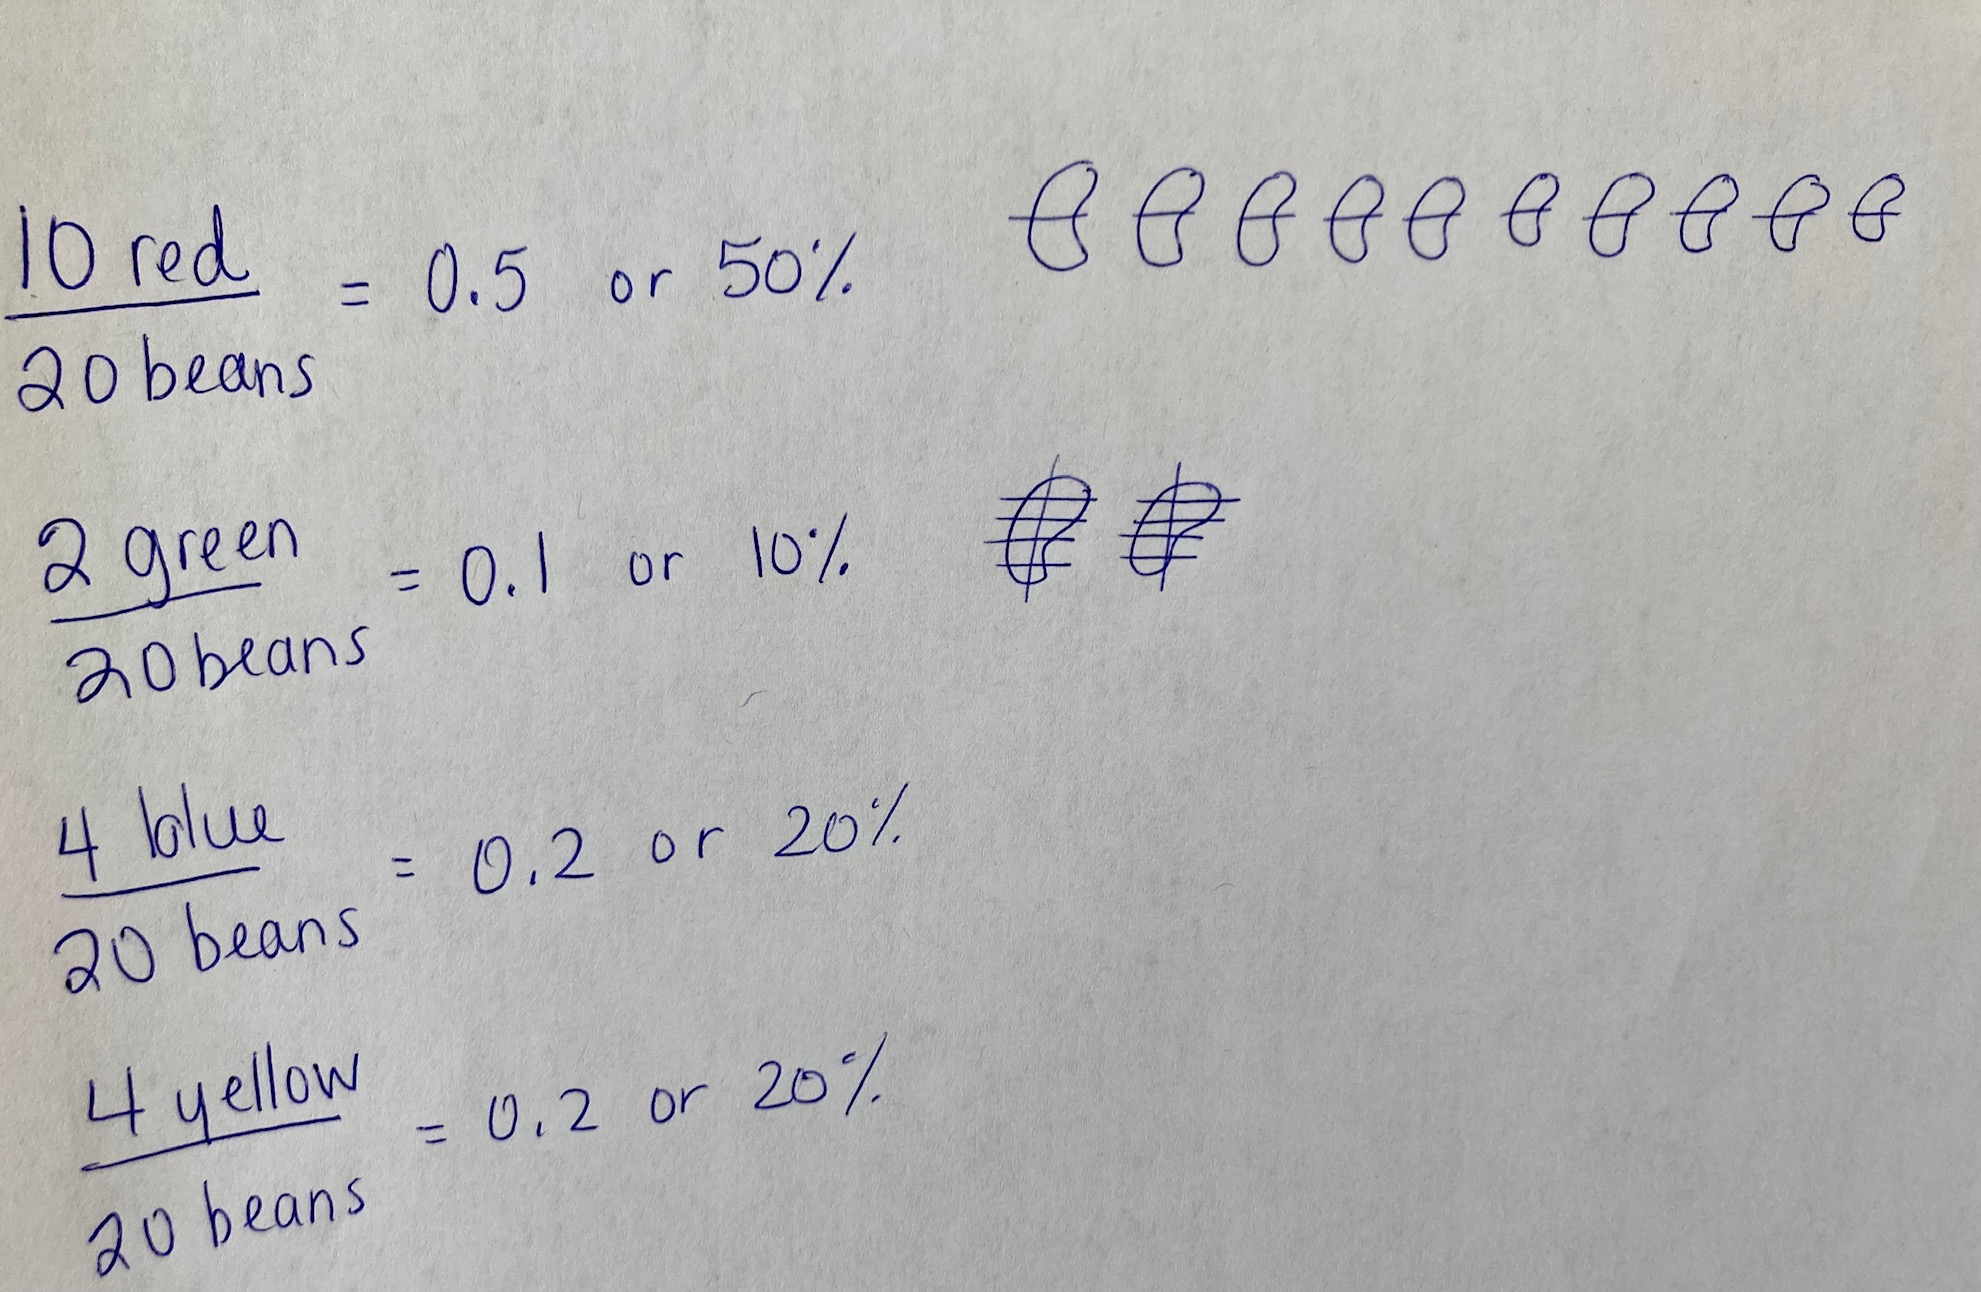
I know that I can take the number of each colour and divide by the number in the bag. This will give me a decimal that I can represent as a percent. 10 jelly beans divided into 20 parts, it’s as if each jelly bean is split in half, because 20 is twice as many as 10. So that means it’s 0.5, or 50%. I thought about the green, 2 greens divided by 20 total, I imagined each bean was cut into ten parts, because 20 is ten times greater than 2. So it is one-tenth, or 10%. I realized 4 jelly beans is twice as many as 2, so yellow and blue must be 20%.
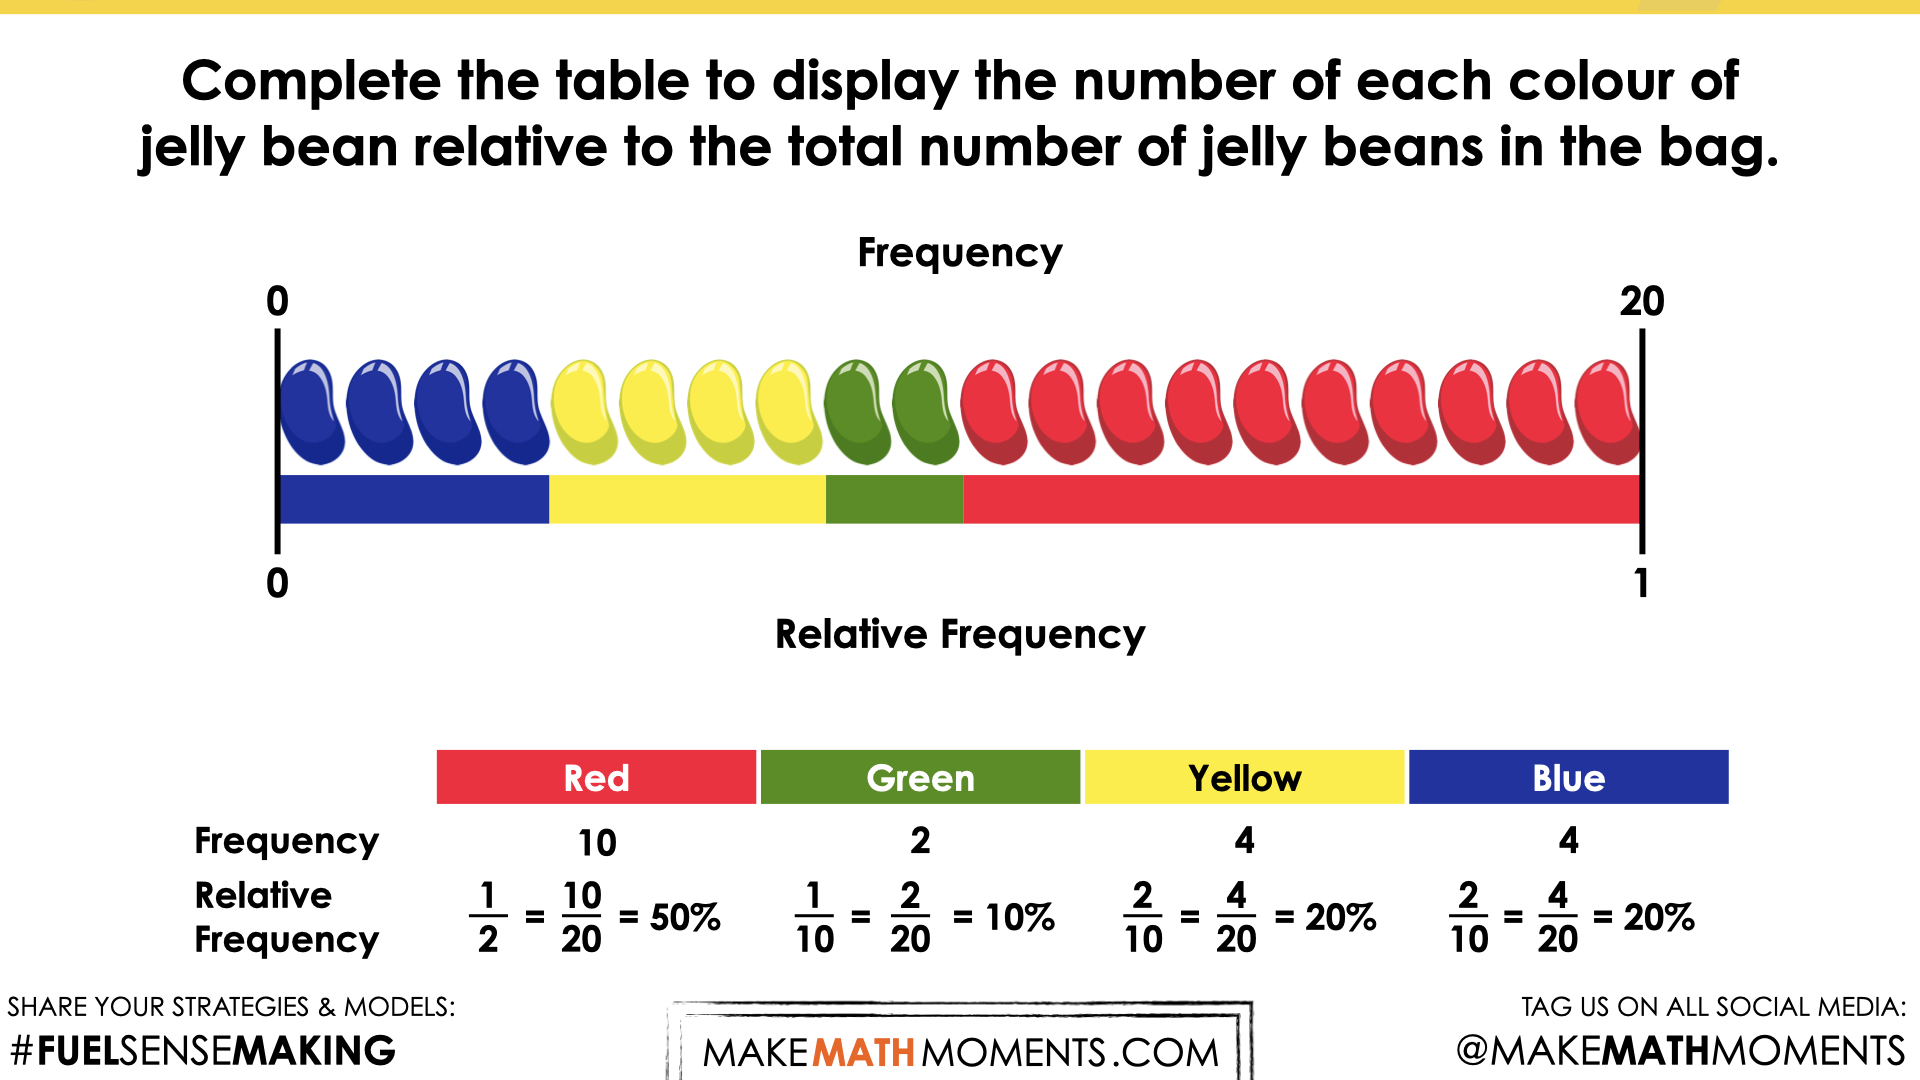
Reveal
Show students the following reveal video:
Provide students an opportunity to reflect on their learning by offering these consolidation prompts to be completed independently.
Consolidation Prompt #1:
Complete the table below:
 Consolidation Prompt #2:
25% of the jelly beans is the same as one-fourth of the bag. Is this statement true? Defend your answer.
We suggest collecting this reflection as an additional opportunity to engage in the formative assessment process to inform next steps for individual students as well as how the whole class will proceed.