Task Teacher Guide
Be sure to read the teacher guide prior to running the task. When you’re ready to run the task, use the tabs at the top of the page to navigate through the lesson.
[accordion openall=”false” clicktoclose=”true” state=”closed” autoclose=”false” openfirst=”true” clicktoclose=”true”]
[accordion-item title=”In This Task…”]
Students will analyze and create stacked bar graphs.
[/accordion-item]
[accordion-item title=”Intentionality…”]
In this task, students will be introduced to the stacked bar graph. Stacked bar graphs can be created horizontally or vertically to display the relative frequency of a data set. Students will look at the flavours in assorted boxes of chocolate. They will compare the relative frequency of each flavour in three different boxes. Some of the big ideas that may emerge in today’s task include:
- Frequency is the number of times a category or event occurs within a data set.
- A relative frequency table shows each category expressed as a fraction of the total quantity or frequency.
- Relative frequency can be represented using fractions, decimals, or percents.
- Fractions, decimals, and percents can all represent relationships to a whole.
- The sum of the relative frequencies is 1 or 100%.
- Stacked-bar graphs display the data proportionally, relative to the whole.
- Stacked-bar graphs relative frequency.
- Each bar in the graph represents a whole, and each of the segments in a bar represents a different category.
- Different colours are used within each bar to represent each category.
[/accordion-item]
[/accordion]
Spark
[accordion openall=”false” clicktoclose=”true” state=”closed” autoclose=”false” openfirst=”false” clicktoclose=”true”]
[accordion-item title=”What Do You Notice? What Do You Wonder?”]
Show students this video:
Then, ask students:
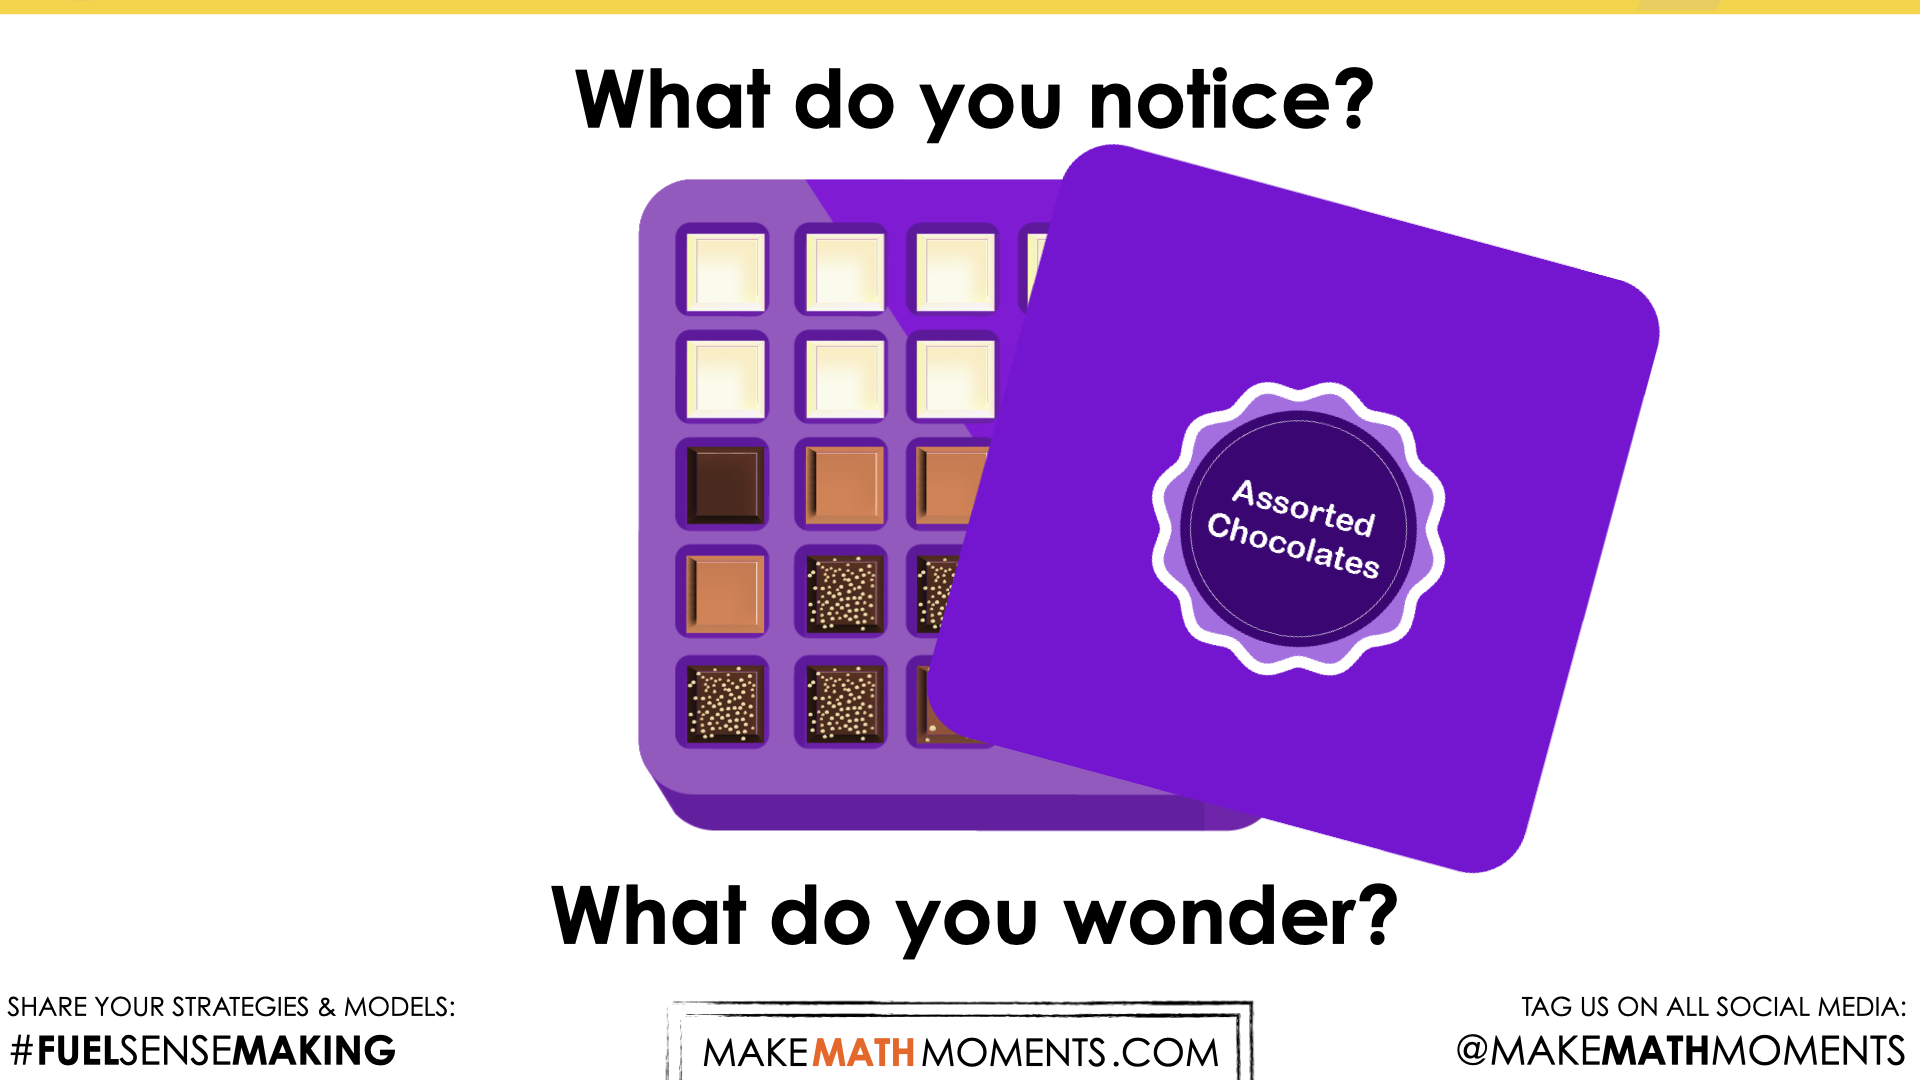
What do you notice?
What do you wonder?
Give students 60 seconds (or more) to do a rapid write on a piece of paper.
Then, ask students to share with their neighbours for another 60 seconds.
Finally, allow students to share with the entire group.
Some of the noticing and wondering that came up in a class recently included:
- I notice a box of chocolates.
- I notice it says “assorted”.
- I notice they are arranged in an array.
- I notice the box is square.
- I notice there are different flavours.
- I wonder why there are different flavours.
- I wonder why there is only one hazelnut.
- I wonder if all the boxes are the same.
- I wonder how much the box costs.
At this point, you can answer any notices and wonders that you can cross off the list right away.
[/accordion-item]
[accordion-item title=”Spark: Make an Estimate”]
Prompt students with:
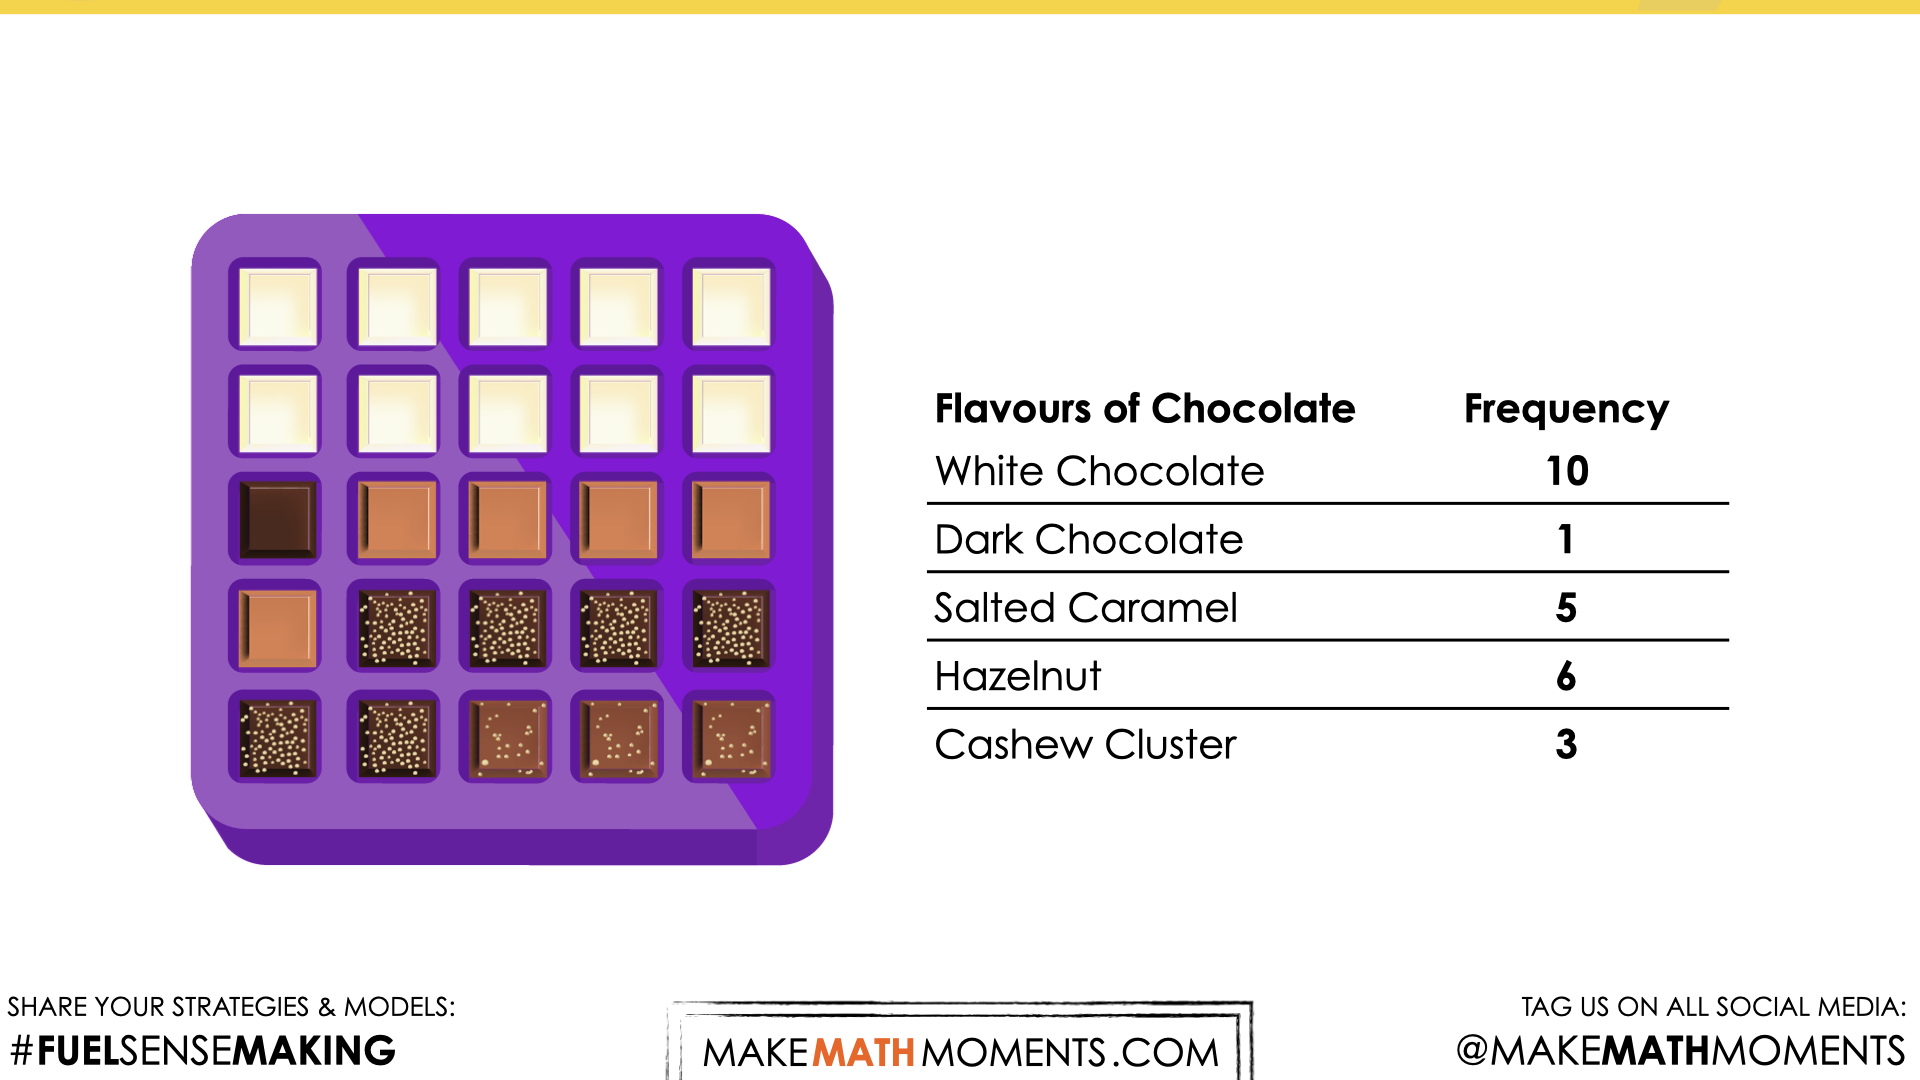
What is the frequency of each type of chocolate?
Make an estimate.
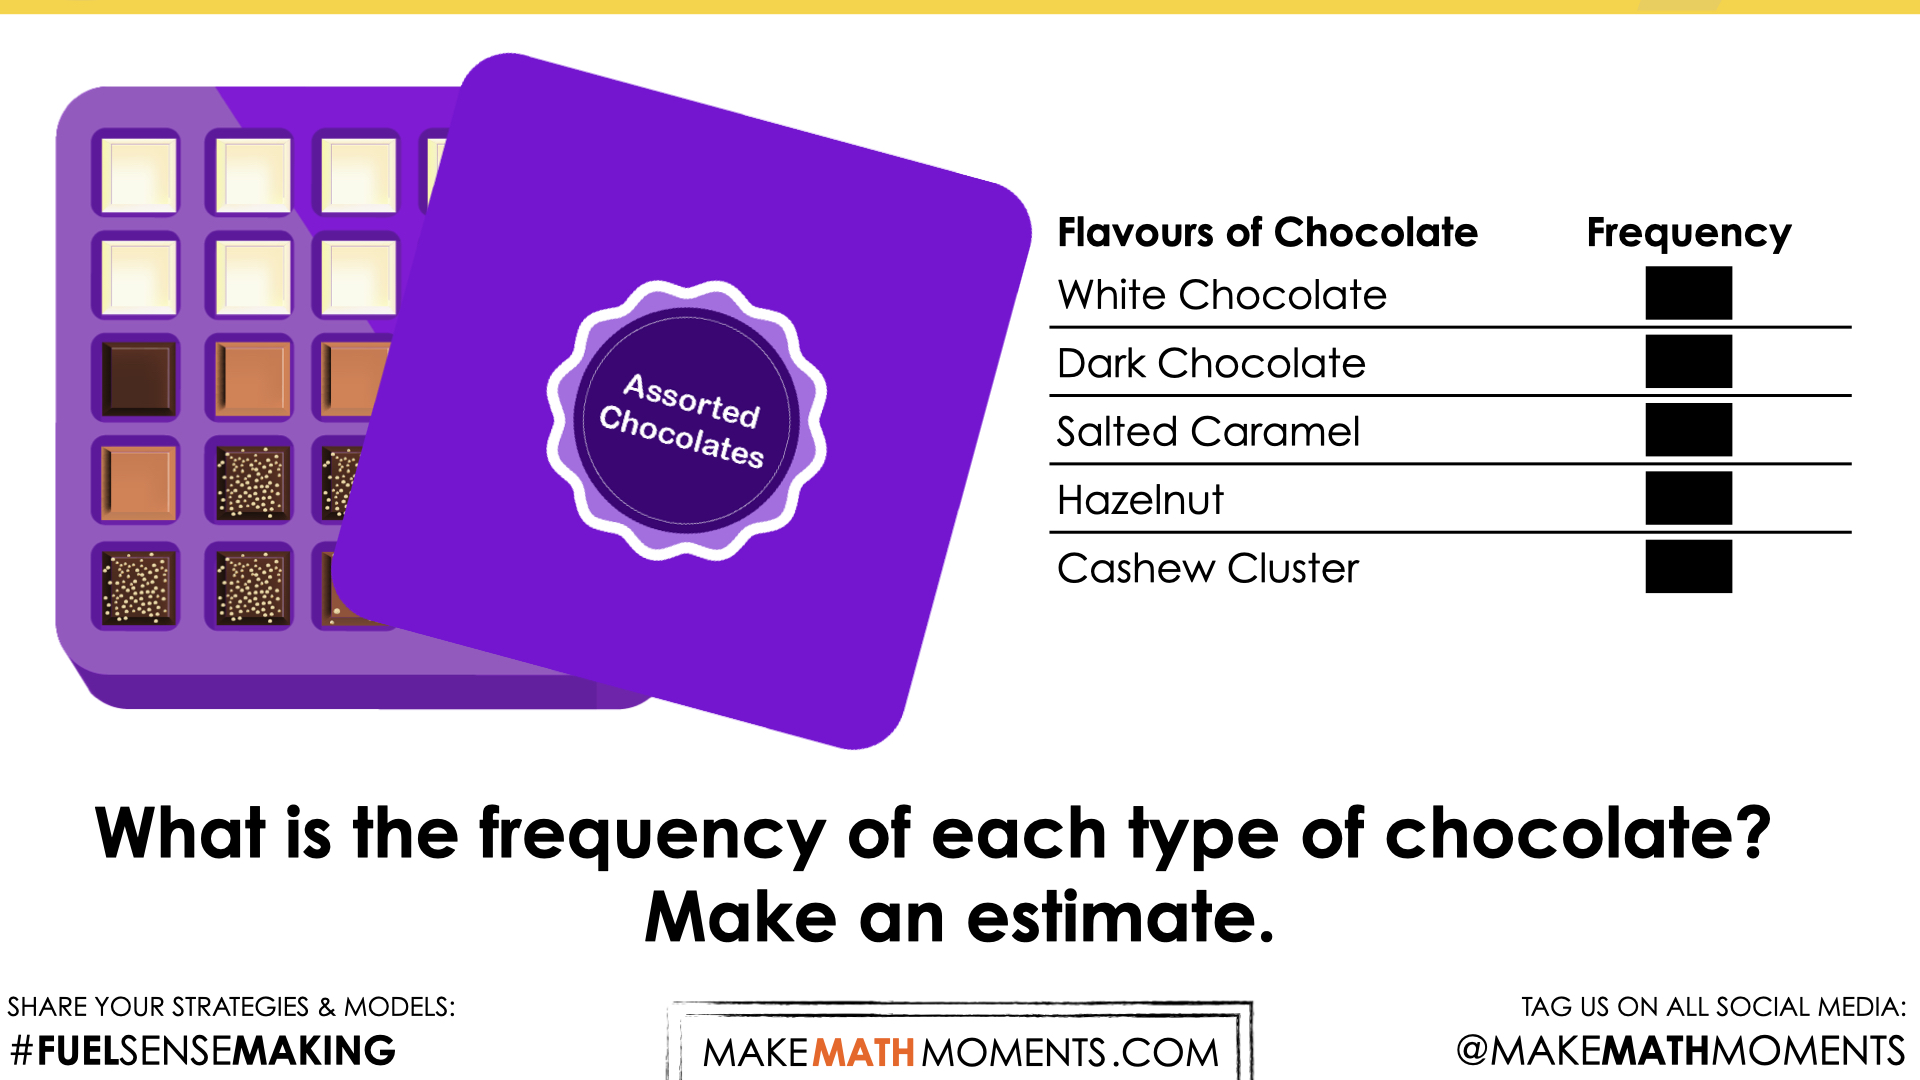
Give students the opportunity to make estimates with their elbow partners before sharing out to the group.
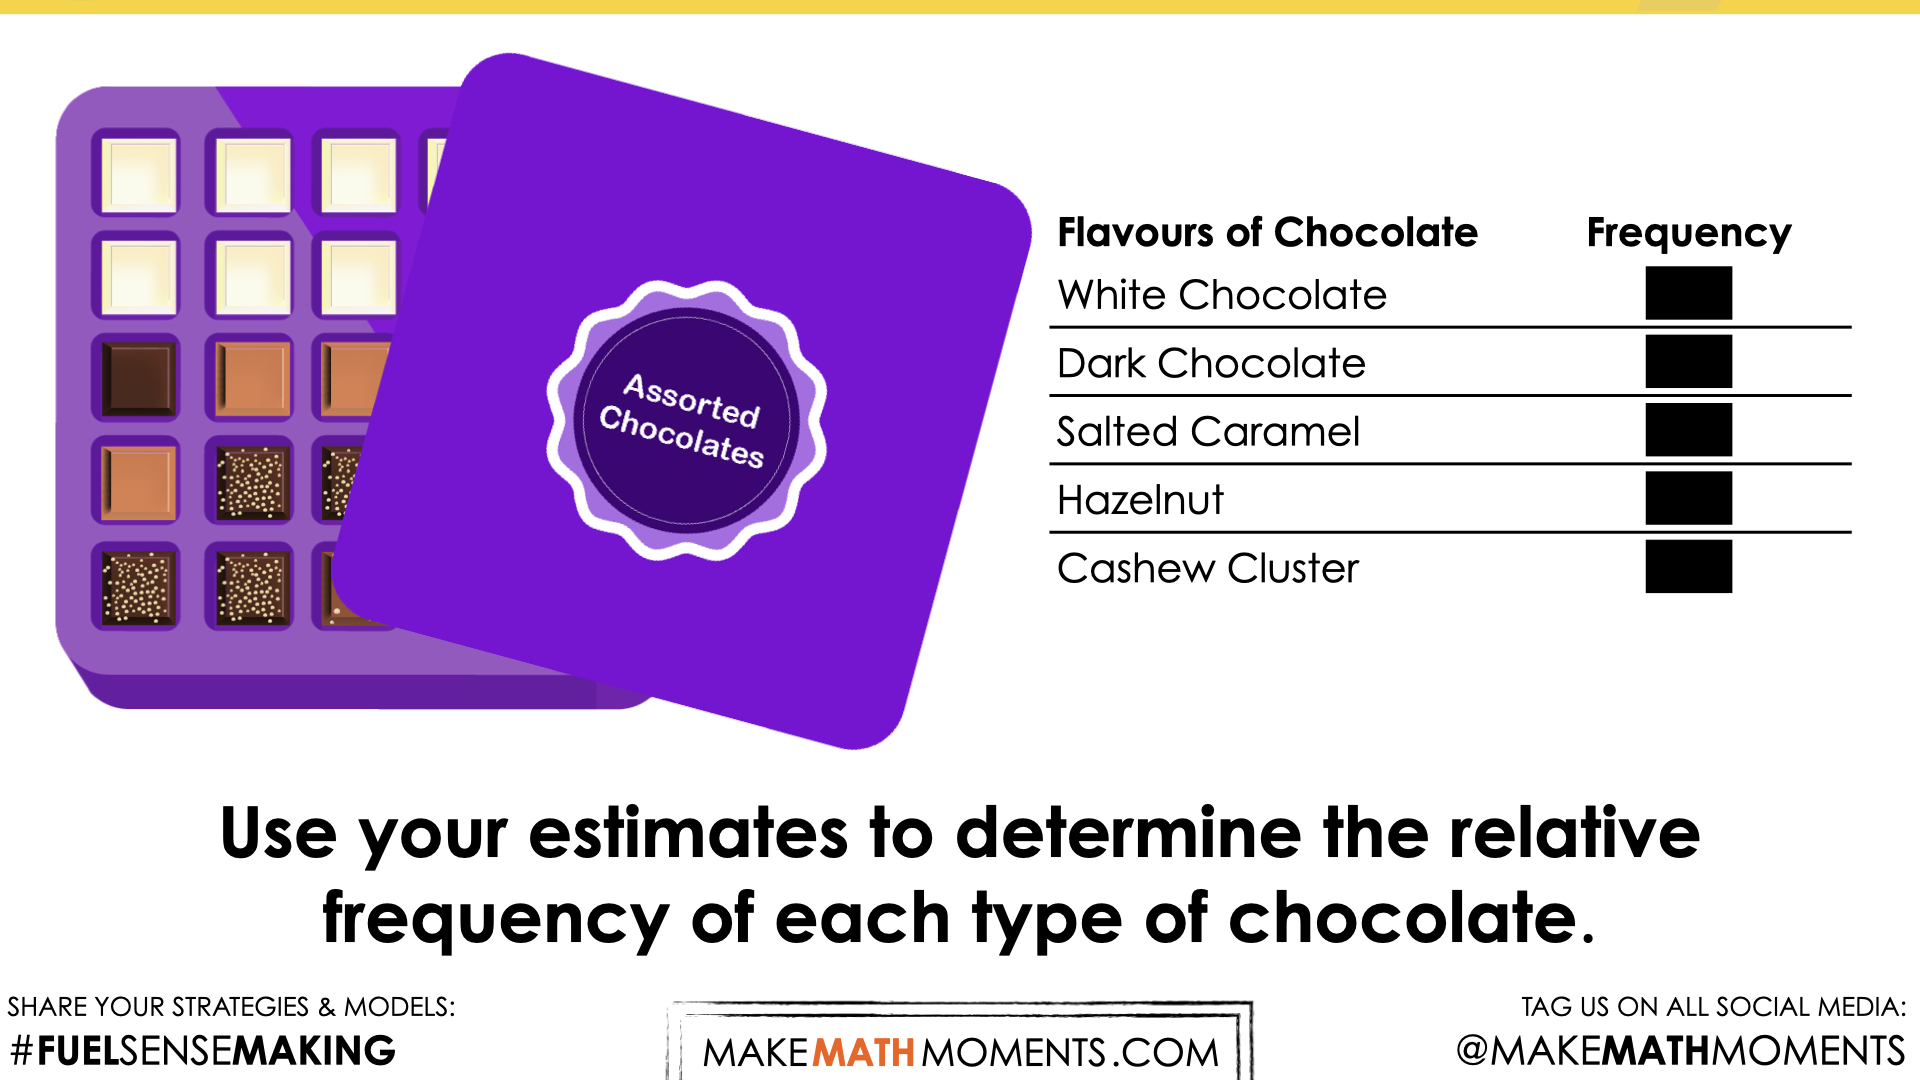
You might also extend this prompt by asking:
Use your estimates to determine the relative frequency of each type of chocolate.
[/accordion-item]
[accordion-item title=”Spark: Estimation Reveal”]
Share the following animation with students:
After the frequency of each chocolate flavour is revealed, construct or share the animation (or screenshot) of the stacked bar graph being created.
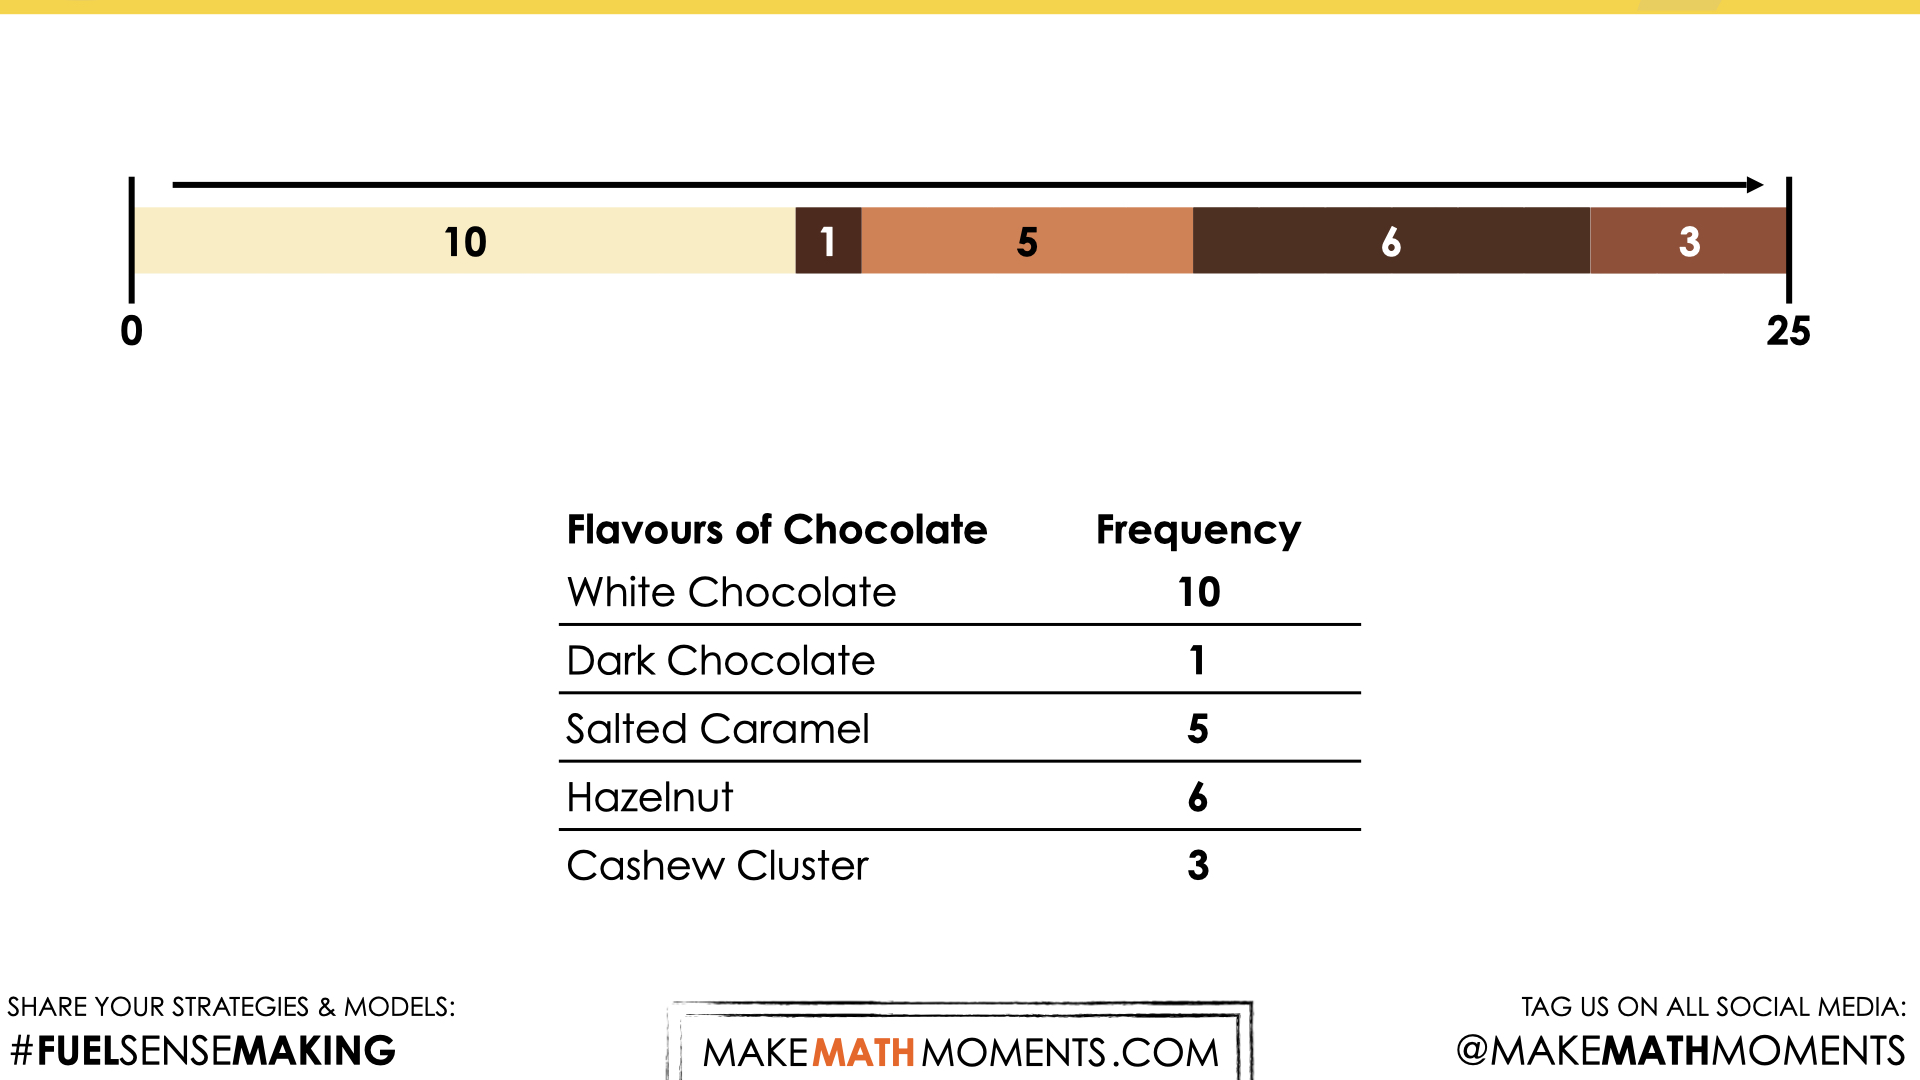
Ask students to consider what this graph can tell us about the flavours of chocolates in the box. Tell students that this particular type of graph is called a stacked bar graph. A stacked bar graph is another way to display the relative frequency of a data set.
Highlight the following characteristics:
- The bar represents the whole. In this case, all the chocolate in the box.
- Each colour represents a different category. In this case, the different flavours of chocolate.
[/accordion-item]
[/accordion]
Sense Making
[accordion openall=”false” clicktoclose=”true” state=”closed” autoclose=”false” openfirst=”false” clicktoclose=”true”]
[accordion-item title=”Crafting A Productive Struggle: Prompt”]
Since you have already taken some time to set the context for this problem and student curiosity is already sparked, we can now push their thinking further by fuelling sense making.
Share the following silent animation.
You can verbally share the following prompt with students:
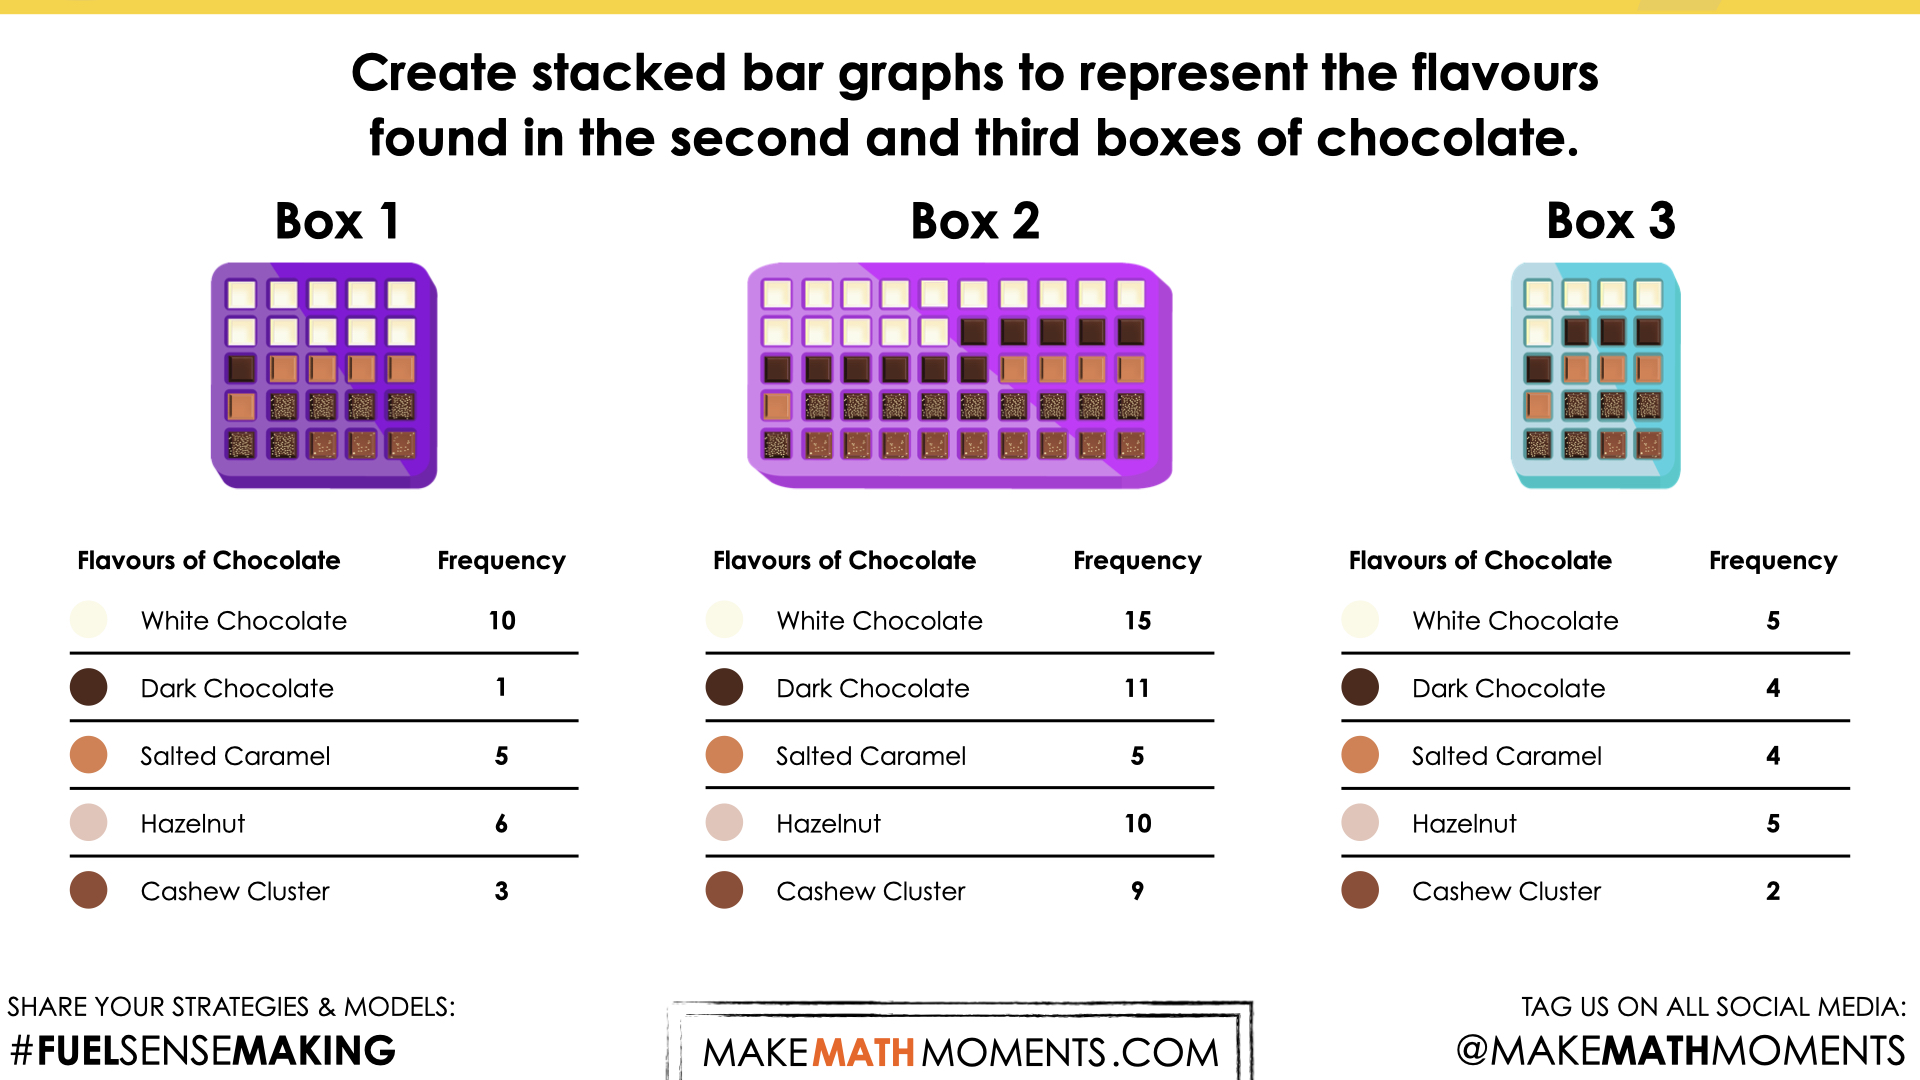
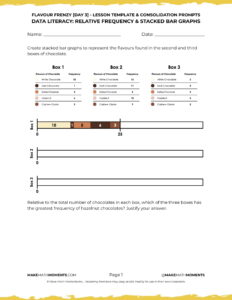
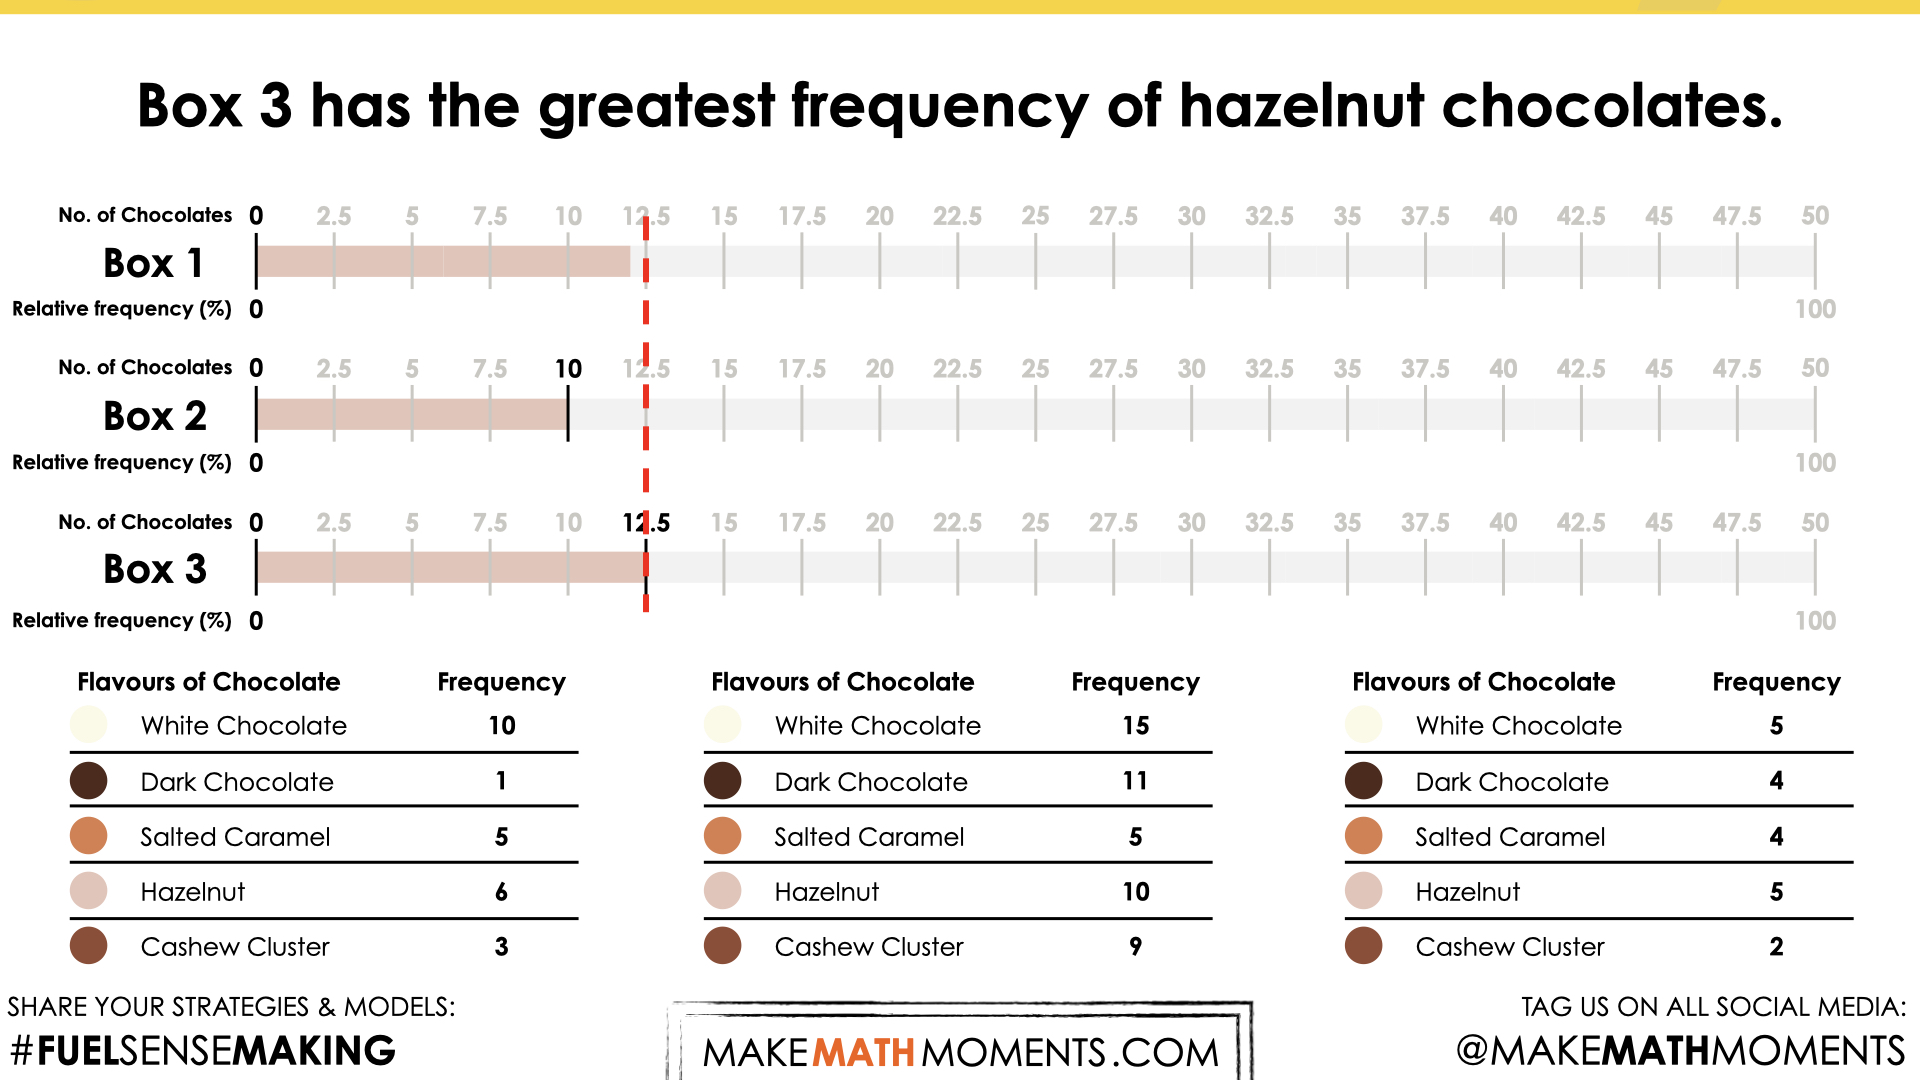
Create stacked bar graphs to represent the flavours found in the second and third boxes of chocolate.
Ask students to answer the following question:
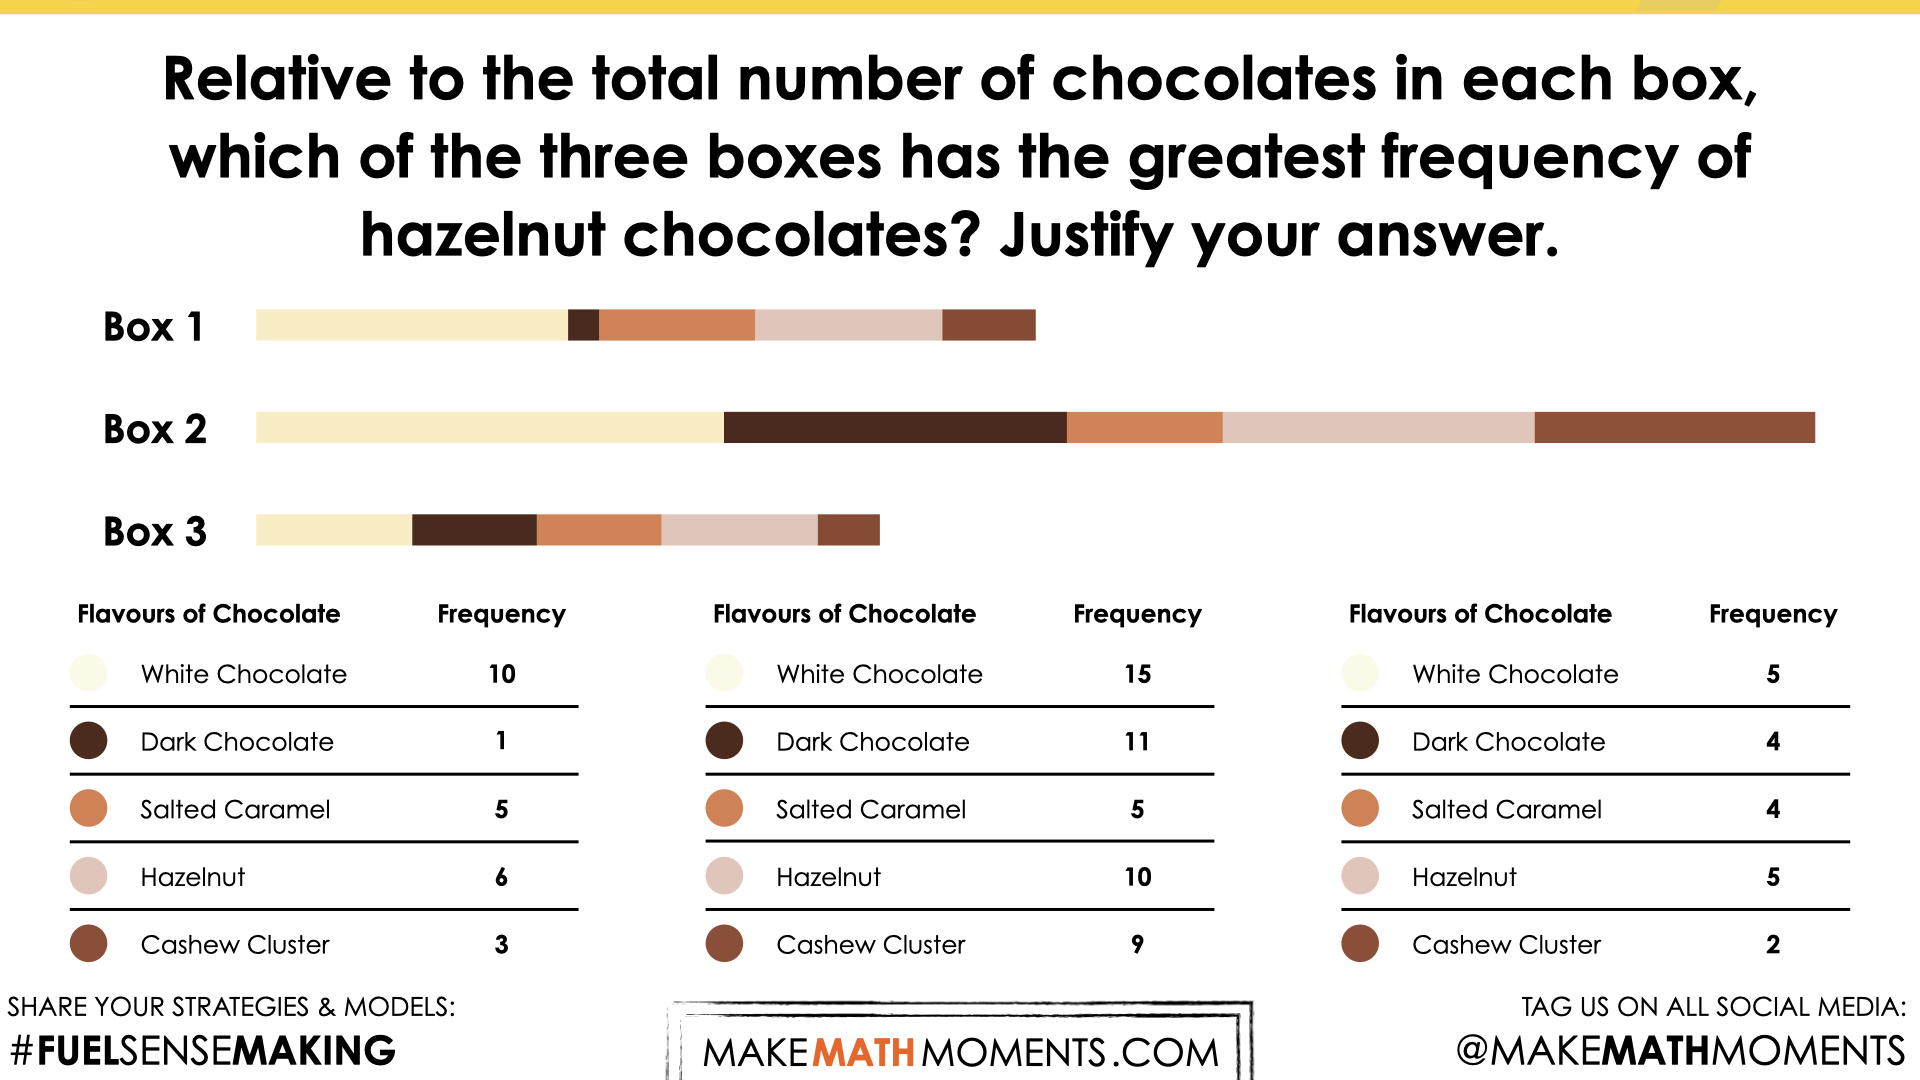
Relative to the total number of chocolates in each box, which of the three boxes has the greatest frequency of hazelnut chocolates? Justify your answer.
[/accordion-item]
[/accordion]
During Moves
[accordion openall=”false” clicktoclose=”true” state=”closed” autoclose=”false” openfirst=”false” clicktoclose=”true”]
[accordion-item title=”While Students Are Productively Struggling…”]
Login/Join to access the entire Teacher Guide, downloadable slide decks and printable handouts for this lesson and all problem based units.
[/accordion-item]
[accordion-item title=”Student Approach #1: Digital Bar Graphs”]
Login/Join to access the entire Teacher Guide, downloadable slide decks and printable handouts for this lesson and all problem based units.
[/accordion-item]
[accordion-item title=”Student Approach #2: Draw Graph & Scaling”]
Login/Join to access the entire Teacher Guide, downloadable slide decks and printable handouts for this lesson and all problem based units.
[/accordion-item]
[/accordion]
Next Moves
[accordion openall=”false” clicktoclose=”true” state=”closed” autoclose=”false” openfirst=”false” clicktoclose=”true”]
[accordion-item title=”Consolidation: Making Connections”]
Login/Join to access the Purposeful Practice as well as the Teacher Guide, downloadable slide decks and printable handouts for this lesson and all problem based units.
[/accordion-item]
[accordion-item title=”Reveal”]
Login/Join to access the Purposeful Practice as well as the Teacher Guide, downloadable slide decks and printable handouts for this lesson and all problem based units.
[/accordion-item]
[accordion-item title=”Reflect”]
Provide students an opportunity to reflect on their learning by offering these consolidation prompts to be completed independently.
Consolidation Prompt #1:
Login/Join to access the Purposeful Practice as well as the Teacher Guide, downloadable slide decks and printable handouts for this lesson and all problem based units.
Consolidation Prompt #2:
Login/Join to access the Purposeful Practice as well as the Teacher Guide, downloadable slide decks and printable handouts for this lesson and all problem based units.
We suggest collecting this reflection as an additional opportunity to engage in the formative assessment process to inform next steps for individual students as well as how the whole class will proceed.
Download Editable/Printable Handout
Become a member to access purposeful practice to display via your projector/TV, download the PDF to upload to your LMS and/or print for students to have a physical copy
[/accordion-item]
[/accordion]
Resources and Downloads
Lesson Tip Sheet
Download the lesson plan in PDF format so you can keep it handy and share with colleagues.
Videos & Images
 Download the videos, images, and related media files to your computer to avoid streaming.
Keynote Slides
 Download in Apple Keynote format to avoid streaming video and run the lesson smoothly.
PowerPoint Slides
 Download in Microsoft PowerPoint format to avoid streaming video and run the lesson smoothly.
Printable Handout
Download/Edit the handout so you can keep it handy and share with colleagues.
Explore The Entire Unit of Study
This Make Math Moments Task was designed to spark curiosity for a multi-day unit of study with built in purposeful practice, and extensions to elicit and emerge mathematical models and strategies.
Click the links at the top of this task to head to the other related lessons created for this unit of study.
[accordion openall=”false” clicktoclose=”true” state=”closed” autoclose=”false” openfirst=”true” clicktoclose=”true”]
[accordion-item title=”What do you notice? What do you wonder?”]
[/accordion-item]
[accordion-item title=”Spark Image”]
[/accordion-item]
[accordion-item title=”Estimation: Image #1″]
[/accordion-item]
[accordion-item title=”Estimation: Image #2″]
[/accordion-item]
[accordion-item title=”Estimation Reveal: Video”]
[/accordion-item]
[accordion-item title=”Estimation Reveal: Image”]
[/accordion-item]
[/accordion]
[accordion openall=”false” clicktoclose=”true” state=”closed” autoclose=”false” openfirst=”true” clicktoclose=”true”]
[accordion-item title=”Struggle Prompt: Video”]
[/accordion-item]
[accordion-item title=”Struggle Prompt: Image”]
[/membership]
[/accordion-item]
[/accordion]
[accordion openall=”false” clicktoclose=”true” state=”closed” autoclose=”false” openfirst=”true” clicktoclose=”true”]
[accordion-item title=”Reveal: Video”]
[/accordion-item]
[accordion-item title=”Reveal: Image”]
[/accordion-item]
[/accordion]
[accordion openall=”false” clicktoclose=”true” state=”closed” autoclose=”false” openfirst=”true” clicktoclose=”true”]
[accordion-item title=”Consolidation Prompt #1″]
Login/Join to access the entire Teacher Guide, downloadable slide decks and printable handouts for this lesson and all problem based units.
[/accordion-item]
[accordion-item title=”Consolidation Prompt #2″]
Login/Join to access the entire Teacher Guide, downloadable slide decks and printable handouts for this lesson and all problem based units.
[/accordion-item]
[/accordion]
Download Editable/Printable Handout
Become a member to access purposeful practice to display via your projector/TV, download the PDF to upload to your LMS and/or print for students to have a physical copy