What Do You Notice? What Do You Wonder?
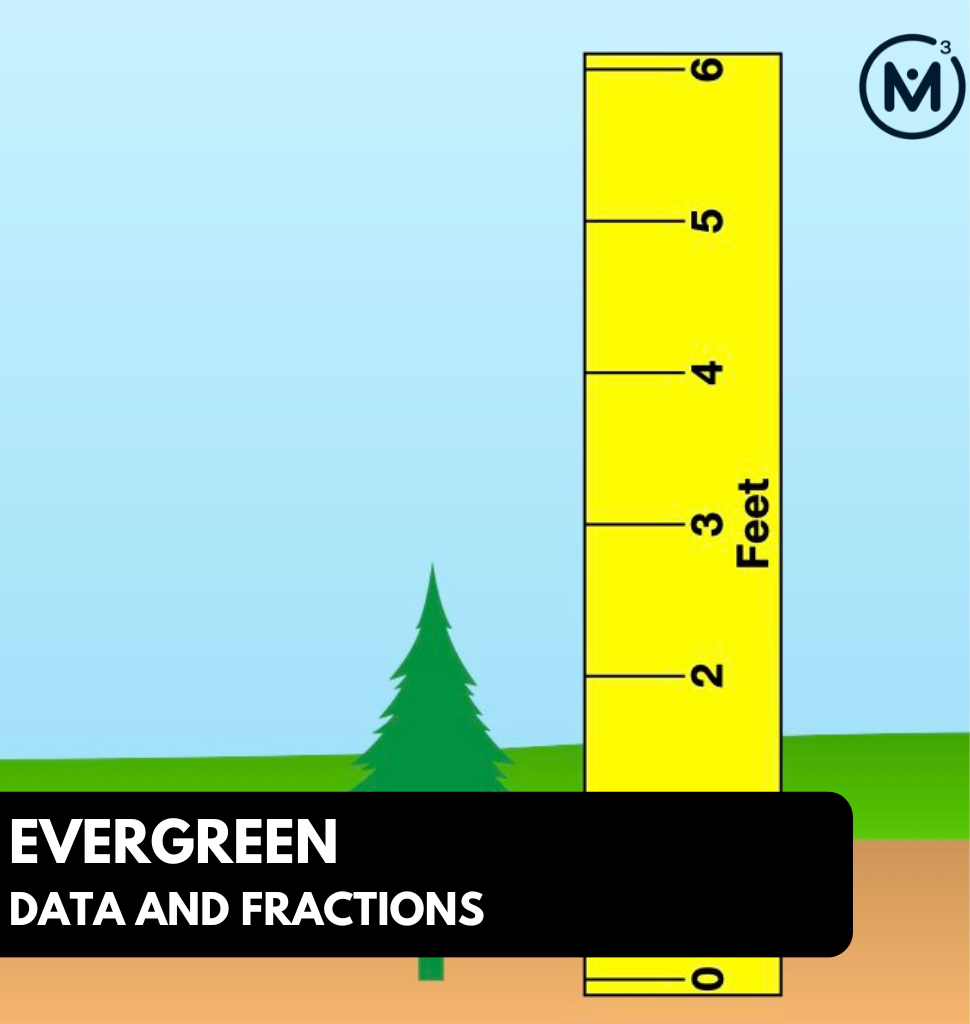
Share the following video with students showing an evergreen tree appearing on the screen with a measuring stick next to it.
Then, ask students:
What do you notice?
What do you wonder?

Give students 60 seconds (or more) to do a rapid write on a piece of paper.
Then, ask students to share with their neighbours for another 60 seconds.
Finally, allow students to share with the entire group.
Some of the noticing and wondering that came up in a class recently included:
- I notice a tree.
- I notice a measuring stick.
- I notice the measuring stick is in feet.
- I notice the tree is between 2 and 3 feet tall.
- I wonder what kind of tree this is.
- I wonder exactly how tall the tree is.
- I wonder if this is a Christmas tree.
At this point, you can answer any notices and wonders that you can cross off the list right away.
Estimation: Prompt
Ask the following question:
What is the height of this tree? Be as precise as you can be with your estimate.
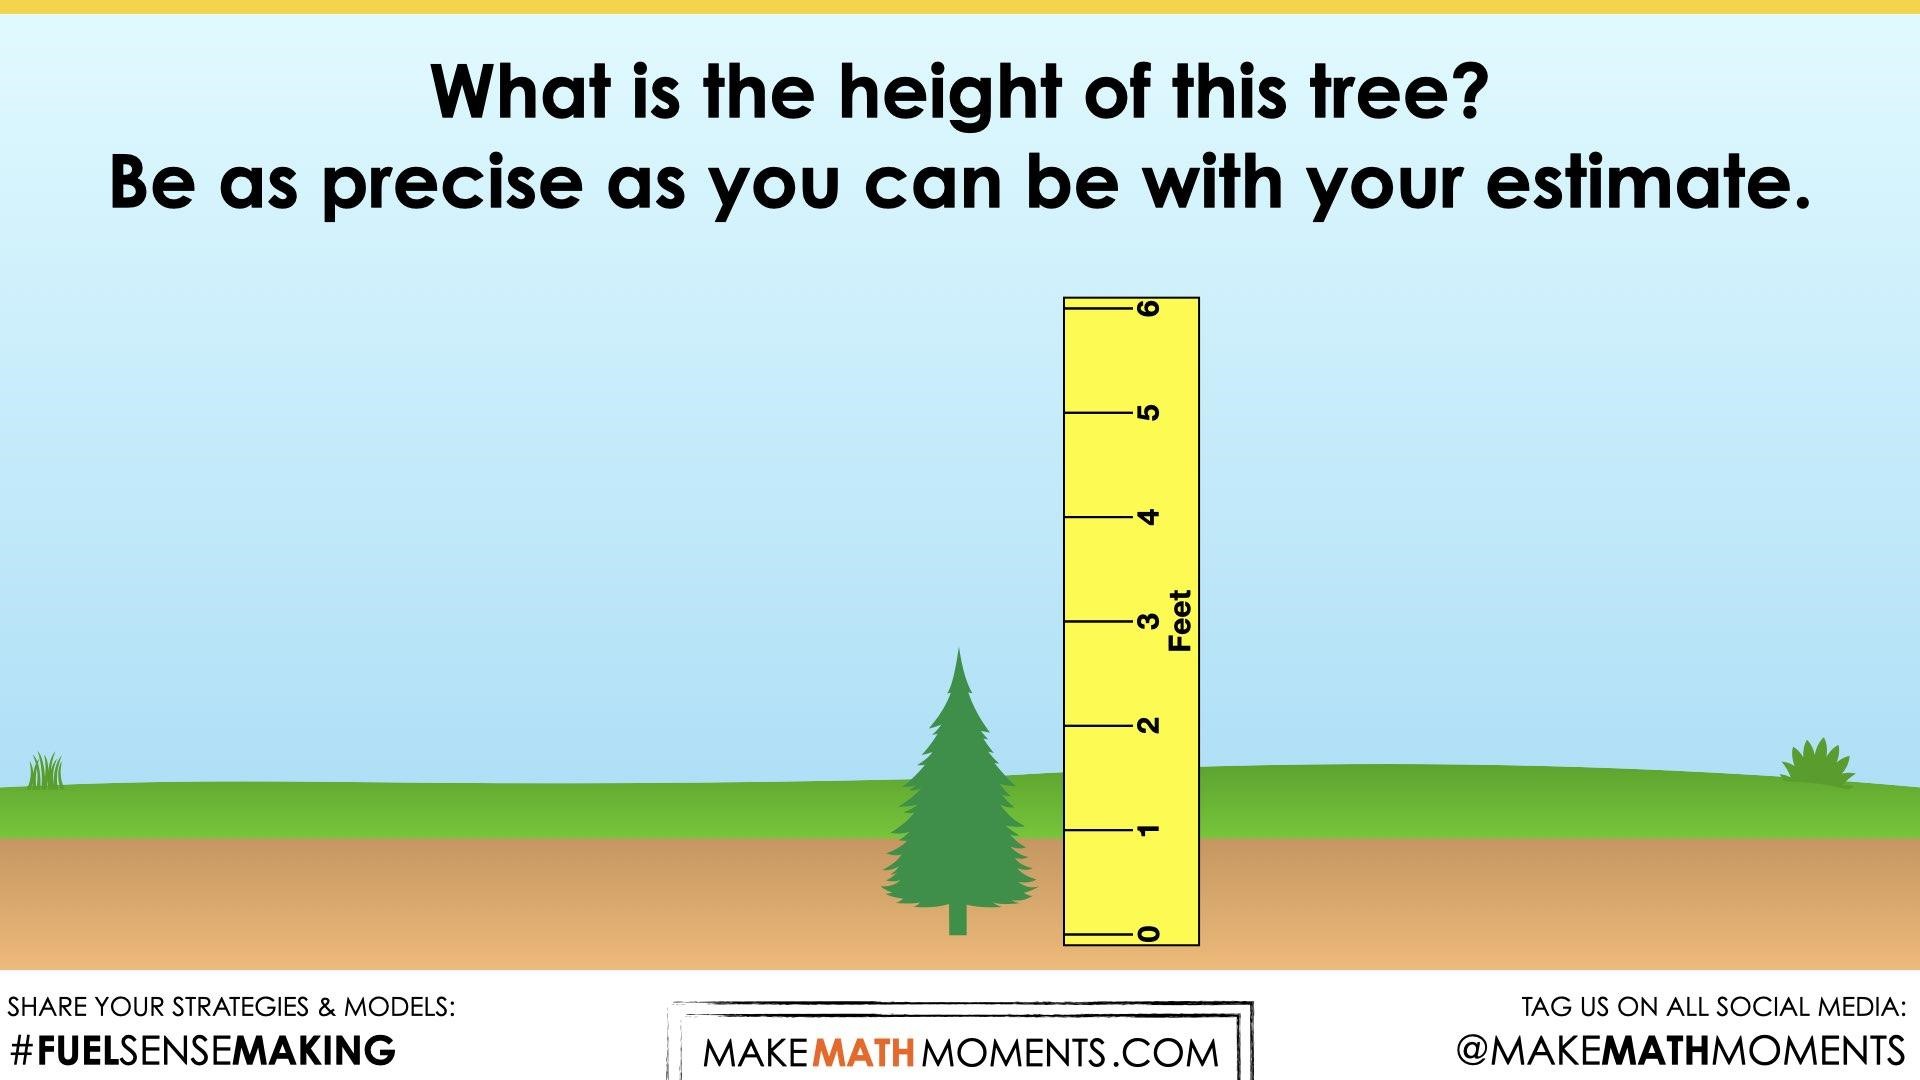
We can now ask students to make an estimate (not a guess) as we want them to be as strategic as they can possibly be. This will force them to use reasoning to try and come up with a reasonable fraction.
While Students Are Estimating…
Monitor student thinking by circulating around the room and listening to the mathematical discourse. Encourage students to use precise mathematical language and listen for the use of fractional language to describe the height of the tree.
Allow students to share their estimates with neighbours first, then with the class. Write down their estimates on the chalkboard/whiteboard/chart paper so students feel their voices are being heard and so they feel they have a stake in solving this problem.
A great way to build student understanding of the magnitude of number is to record their estimates on a number line for all to see. Another benefit of doing this is to see how estimates continually improve as we learn more and more information about the situation.
Estimation: Reveal
Share the following animation.
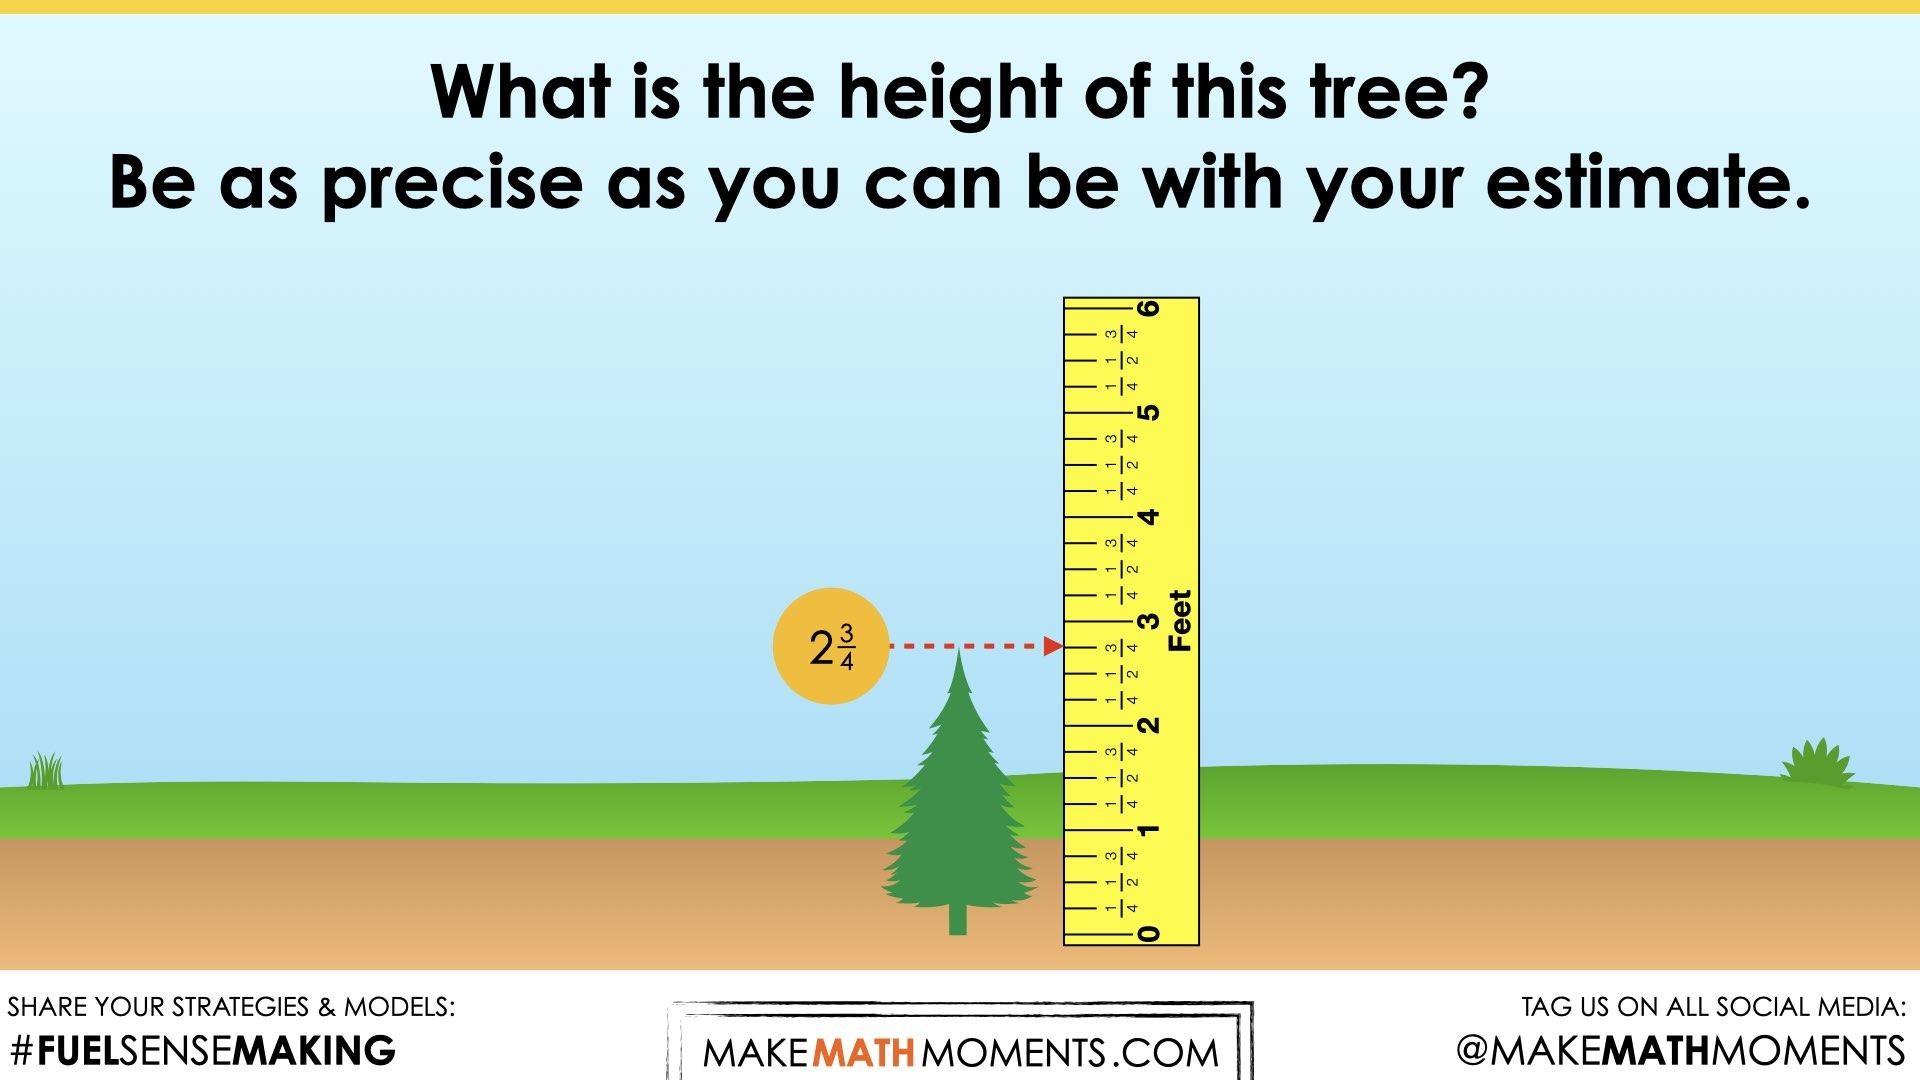
Celebrate students who estimated closest to a length of 2 and 3 fourth feet.
Crafting A Productive Struggle:
Since you have already taken some time to set the context for this problem and student curiosity is already sparked, we have them in a position to push their thinking further and fuel sense making.
Share the following silent animation.
Share the following story verbally to build the context of this problem with students:
Last spring, a tree farmer planted a row of 10 evergreen trees. The farmer went out to measure the height of each tree.
Share the following prompt with students:
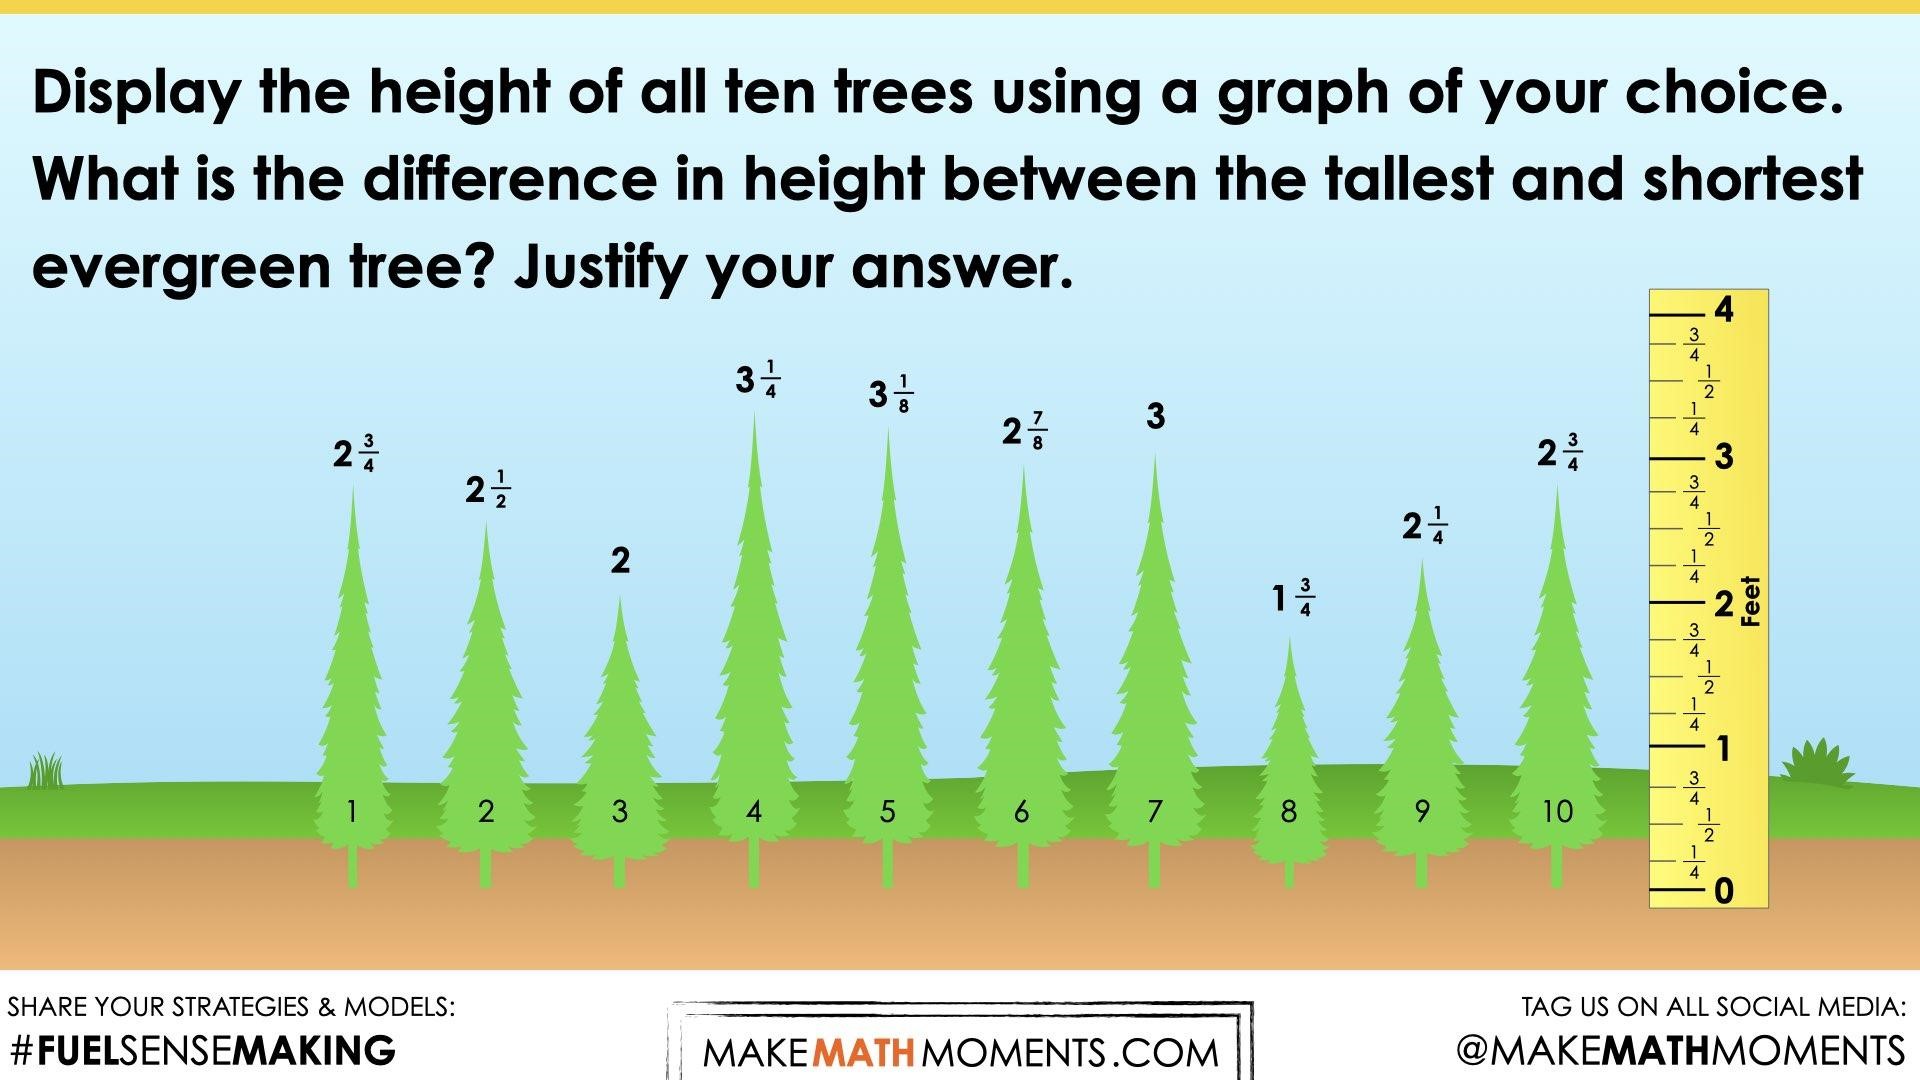
Display the height of all ten trees using a graph of your choice.
What is the difference in height between the tallest and shortest evergreen tree? Justify your answer.
You may choose to offer just the first prompt (graphing) and then the second (finding the difference) if you feel that scaffolding would be helpful for your learners.
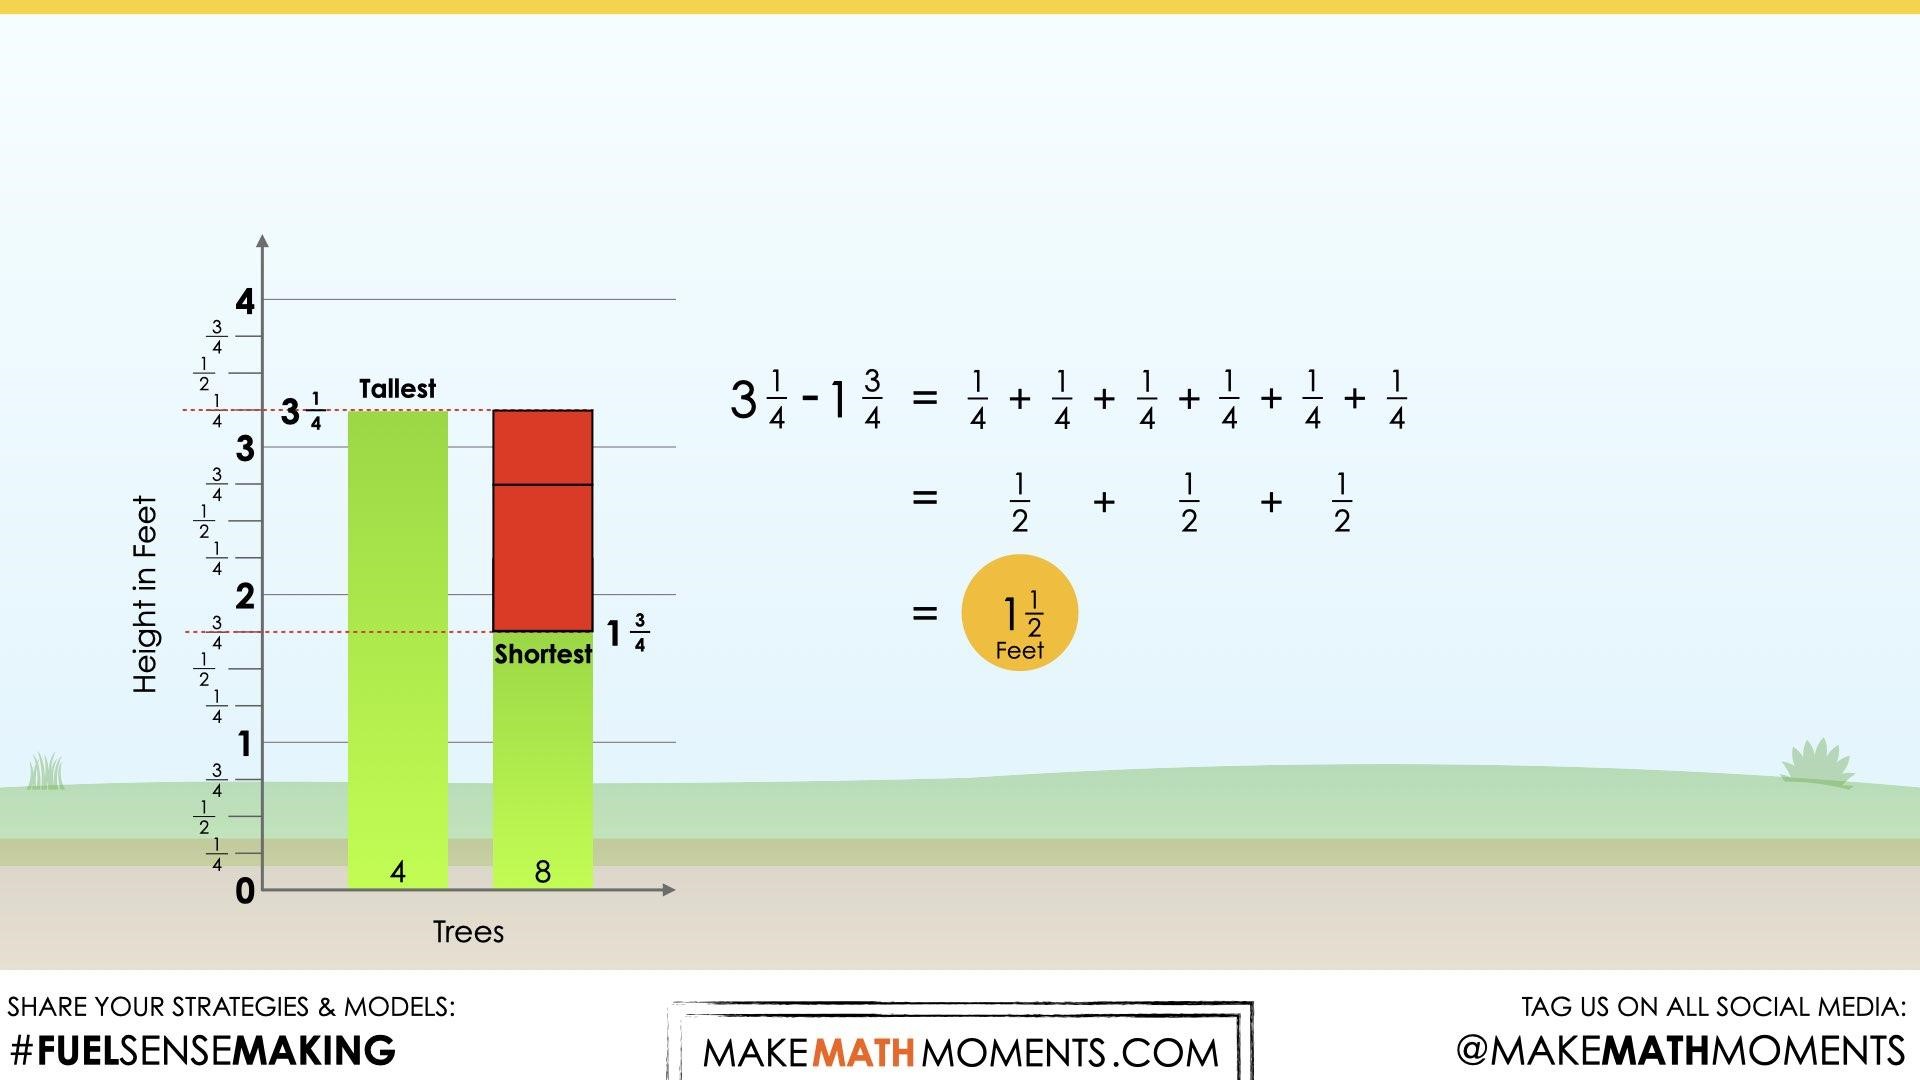
Student Approach #1: Digital Bar Model & Counting
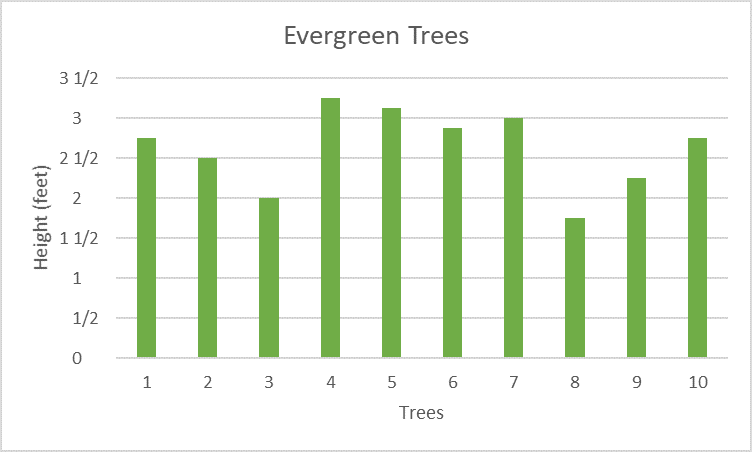
I used excel to create a bar graph. I decided to use a bar graph because each tree’s height is separate from the other trees. The idea is to compare their heights. I noticed that tree 8 is the shortest and tree 4 is the tallest from my graph. Tree 8 is 1\(\frac{3}{4}\) feet and tree 4 is 3\(\frac{1}{4}\) feet. I counted by one fourths from 1\(\frac{3}{4}\) to 2\(\frac{1}{4}\). I counted six one-fourths. Tree 4 is six one-fourths taller.
Student Approach #2: Drawn Bar Graph & Linear Model
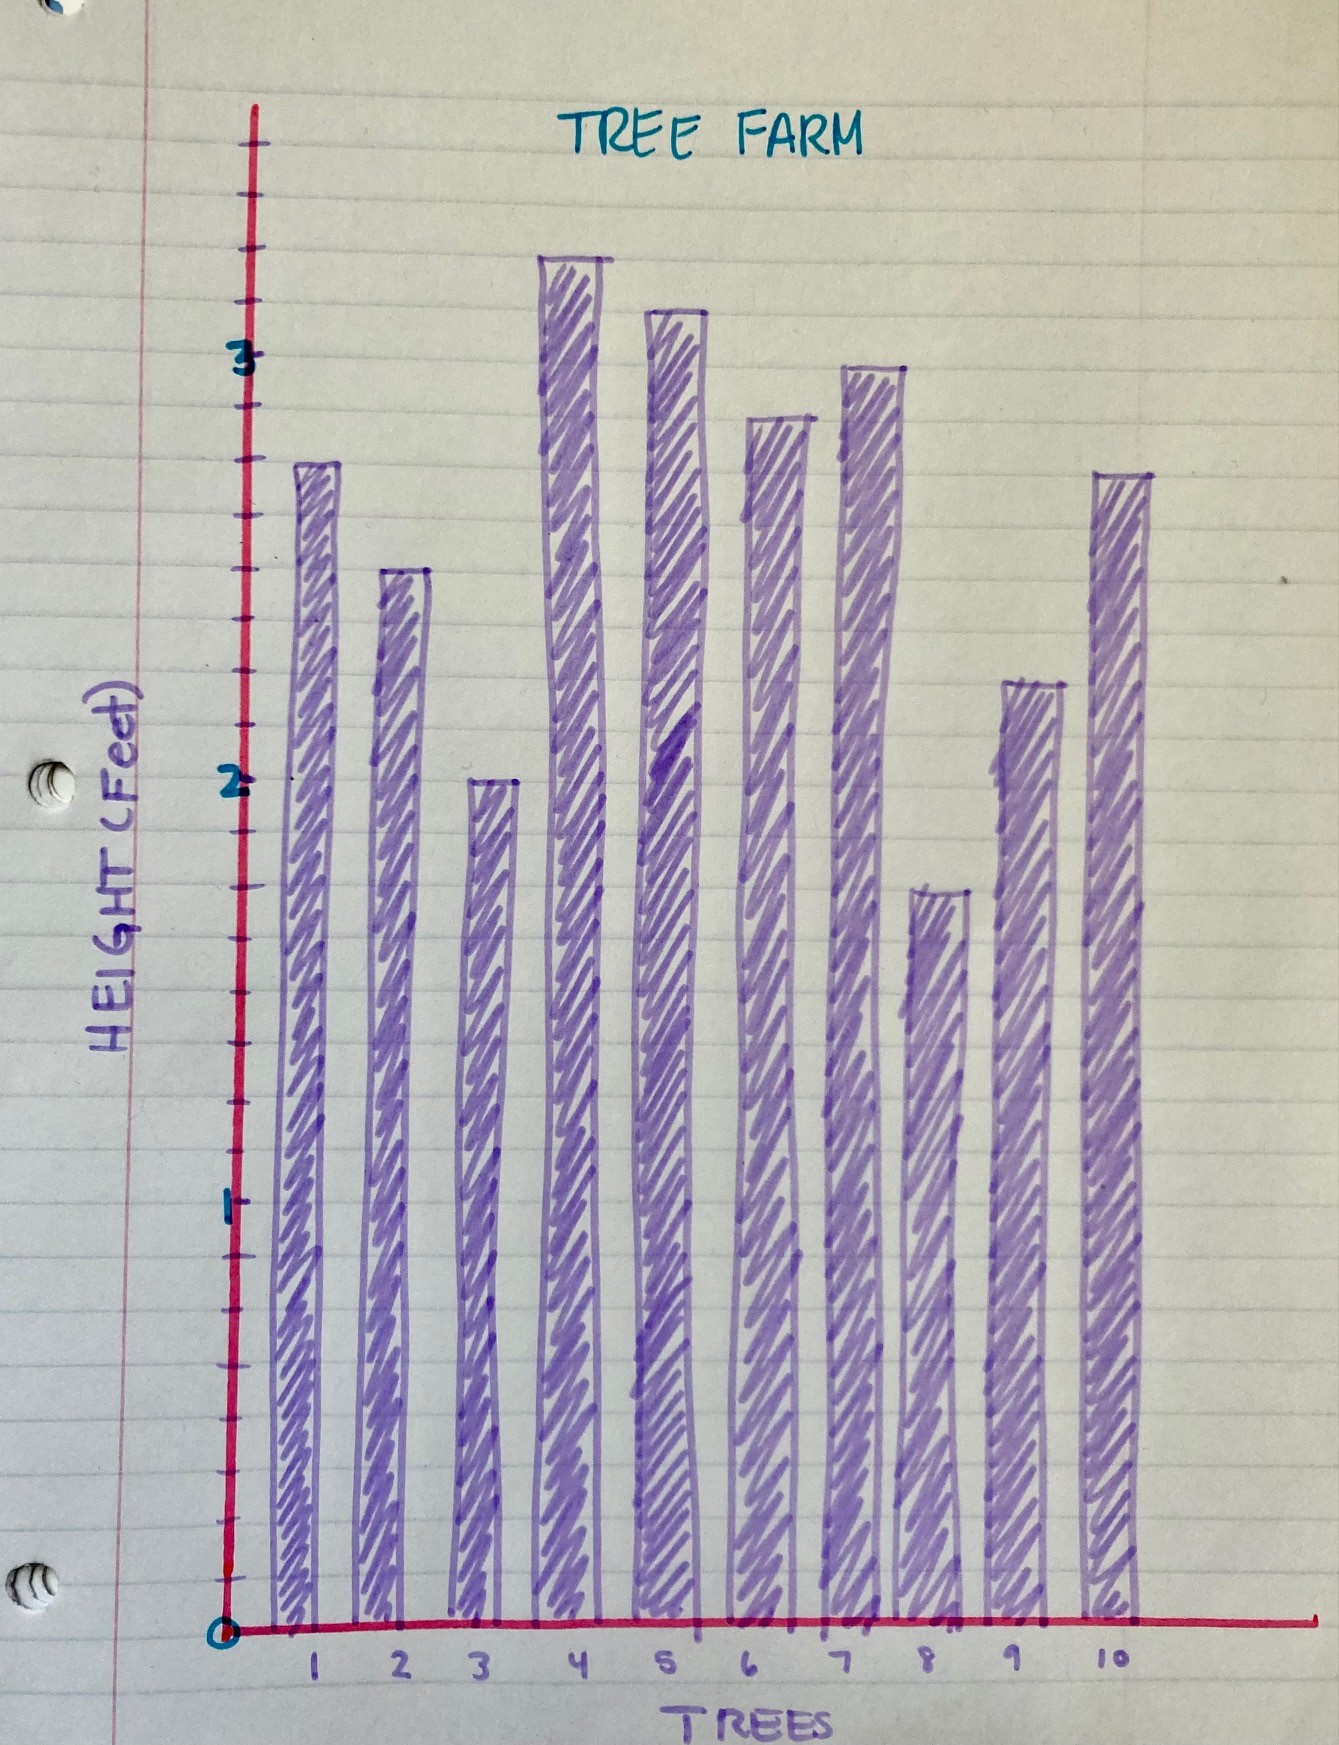
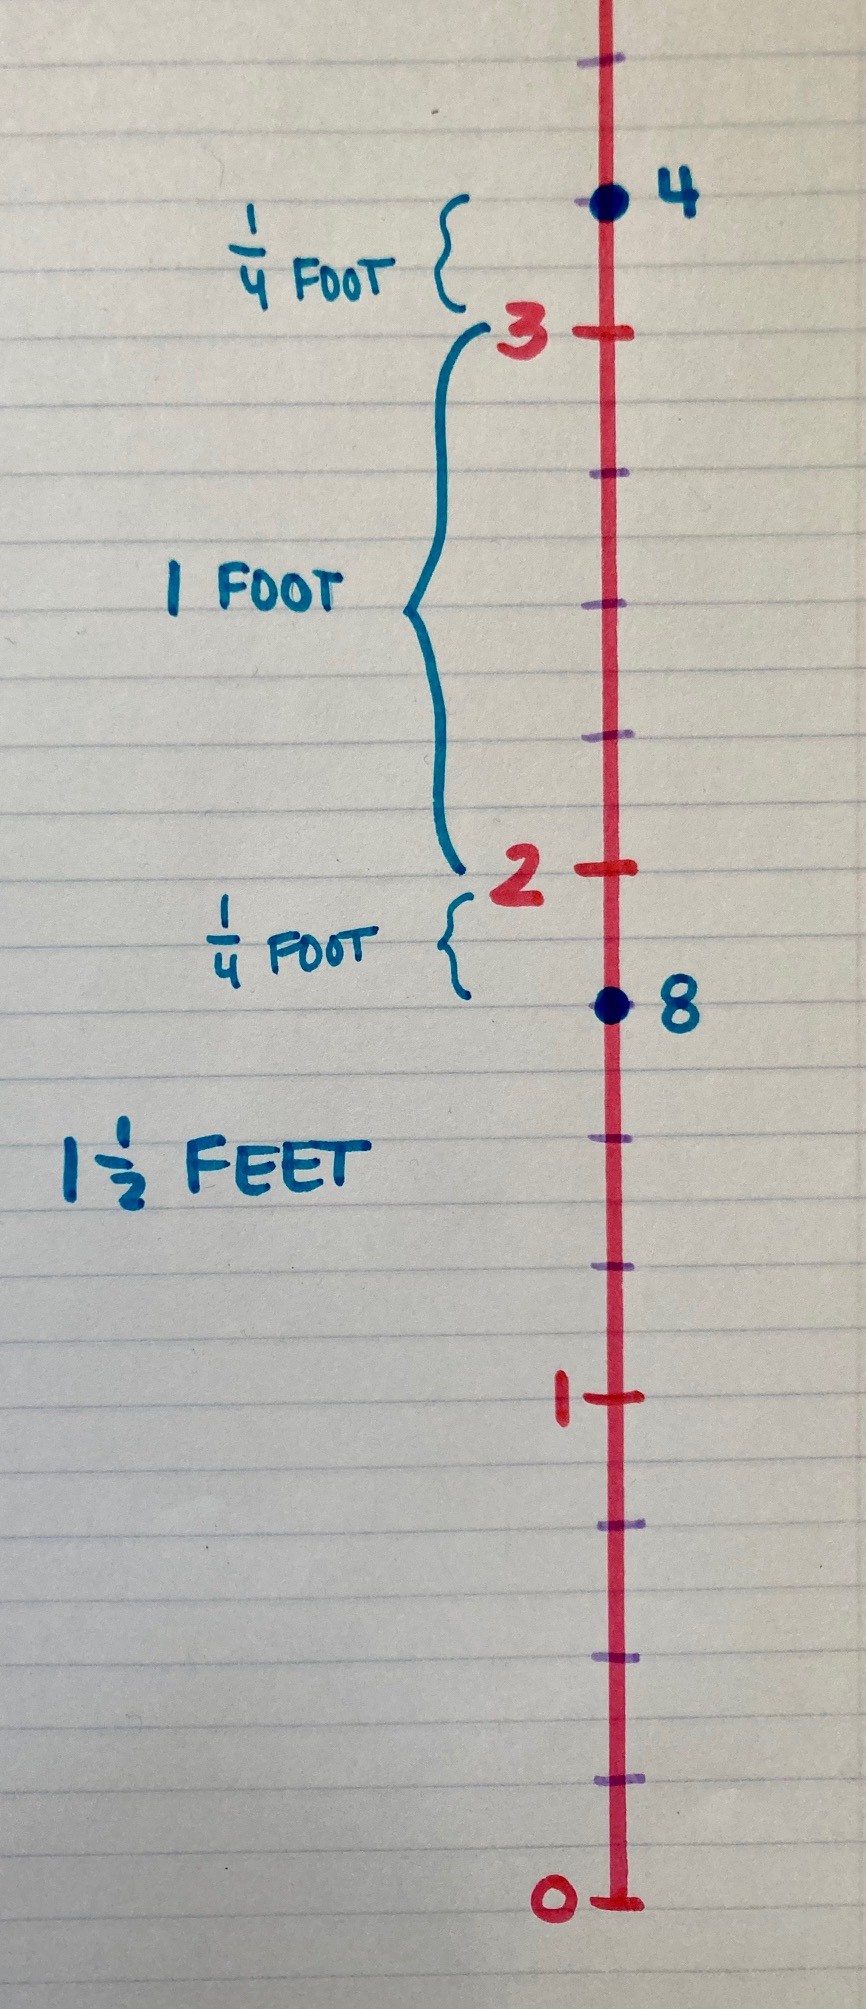
I decided to make a bar graph to show the heights of all ten trees. I used the lines on my paper. I decided to put eight lines between each foot, because the smallest part was one-eighth. I used the lines to find the different heights and create the bars for each tree. To find the difference between tree four and tree eight, I drew a measuring stick. I marked both heights. I saw the difference between the two trees was one whole foot, and two-fourth feet, which is the same as 1\(\frac{1}{2}\) feet.
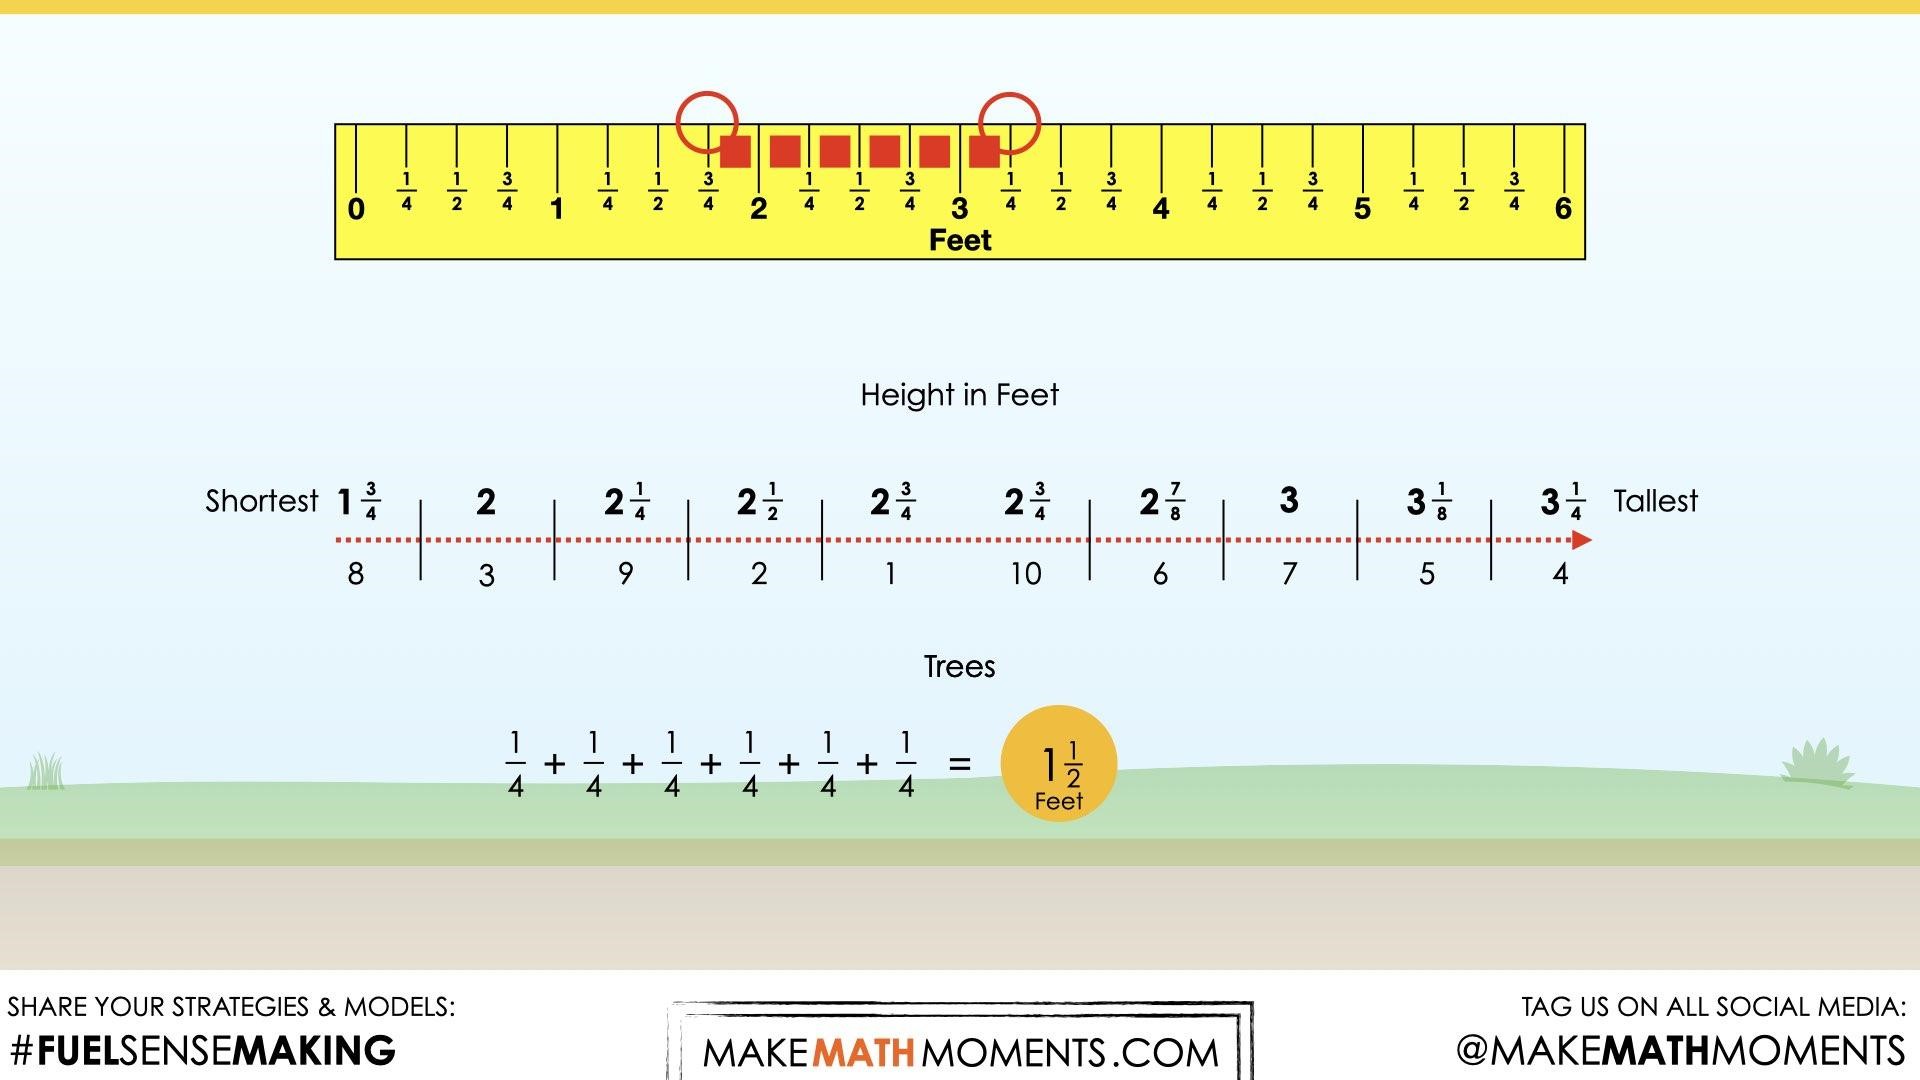
Student Approach #3: Line Plot & Counting On
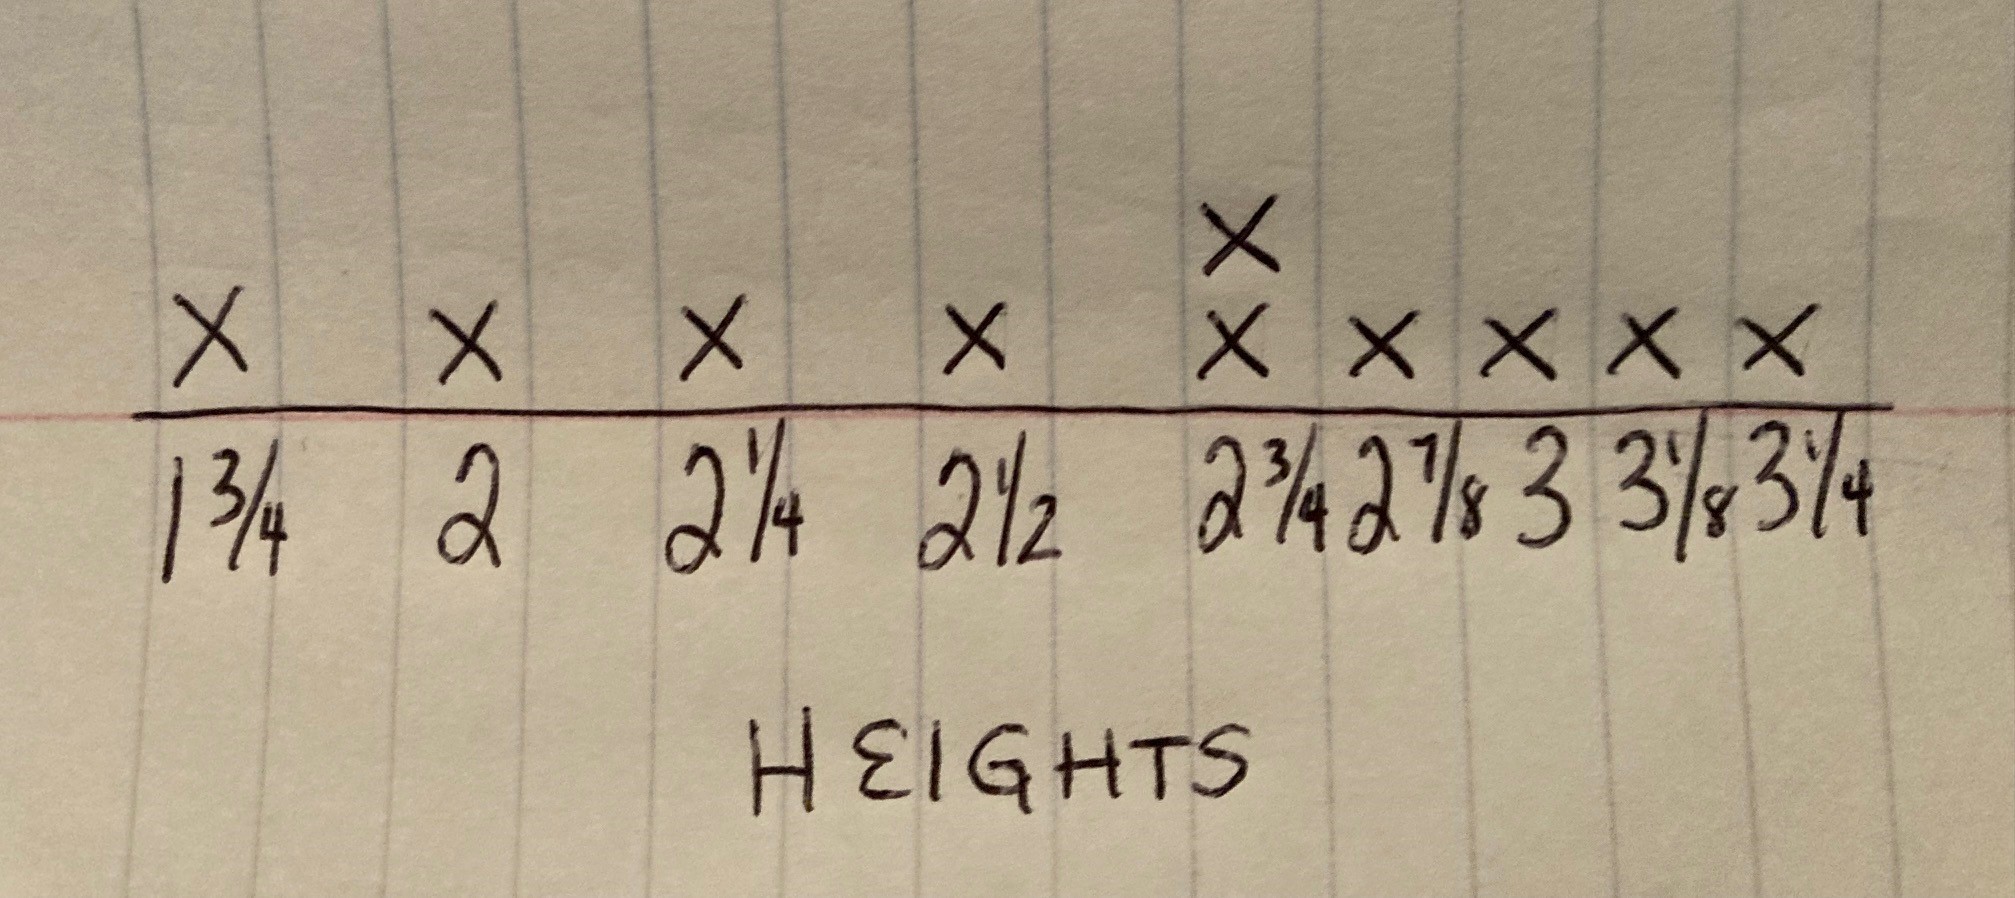
I started by putting the height of the trees in order from least to greatest. I made a number line across the bottom of my page. I decided that every space would be one-eight of a foot. I put an x for every tree. I put two xs on 2\(\frac{3}{4}\) feet because two trees are the same height. I noticed that the smallest tree is 1\(\frac{3}{4}\) feet, and the tallest is 3 and \(\frac{1}{4}\) feet. So I counted up from 1\(\frac{3}{4}\) to 3\(\frac{1}{4}\), and it was 6 fourths, or 1\(\frac{1}{2}\) feet.
Reveal
Depending on how you consolidated the learning by using student solution strategies, you may or may not feel these reveal videos are helpful.
However, if you are just learning to model student thinking and feel it could be helpful for students to see thinking represented visually, consider the following.
In the first reveal video, students see the difference between the tallest and the shortest evergreen trees as a direct comparison of height and we use a counting on strategy with fourths as our unit fraction.
In the second reveal video, students see a more symbolic comparison between the tallest and shortest trees, however the strategy is similar and still accessible.
Provide students an opportunity to reflect on their learning by offering these consolidation prompts to be completed independently.
Consolidation Prompt #1:
Why was a bar graph an appropriate choice to display the height of the trees?
Consolidation Prompt #2:
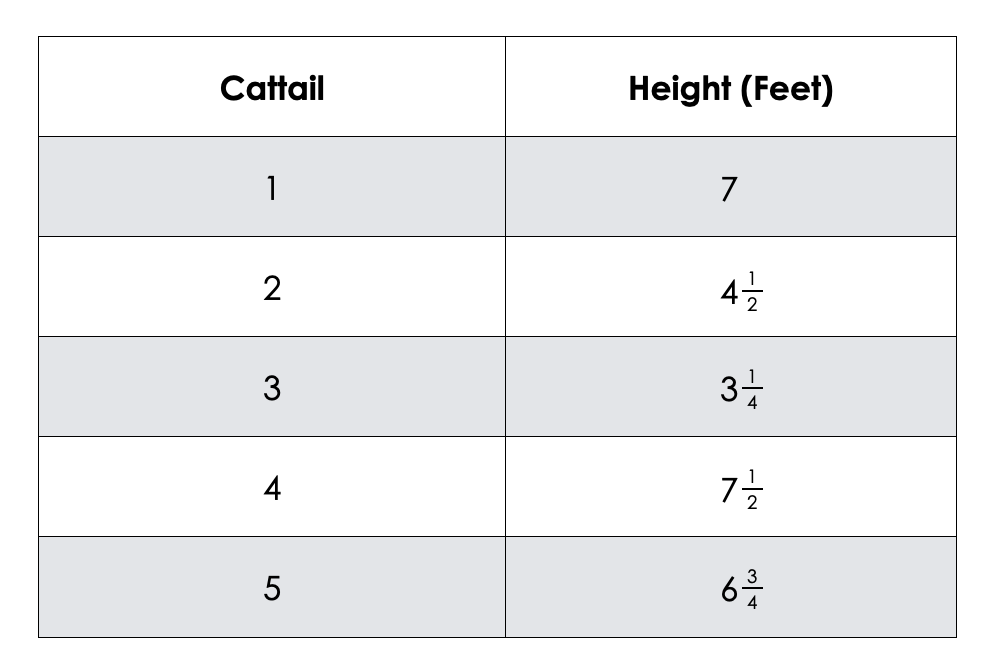
Consider the table below.
a. What scale would you use on the y-axis to display this data? Justify your answer.
b. What is the difference between the shortest and longest cattail?
If this pattern continues, predict how many acorns he will have on day 18. Justify your answer.
We suggest collecting this reflection as an additional opportunity to engage in the formative assessment process to inform next steps for individual students as well as how the whole class will proceed.