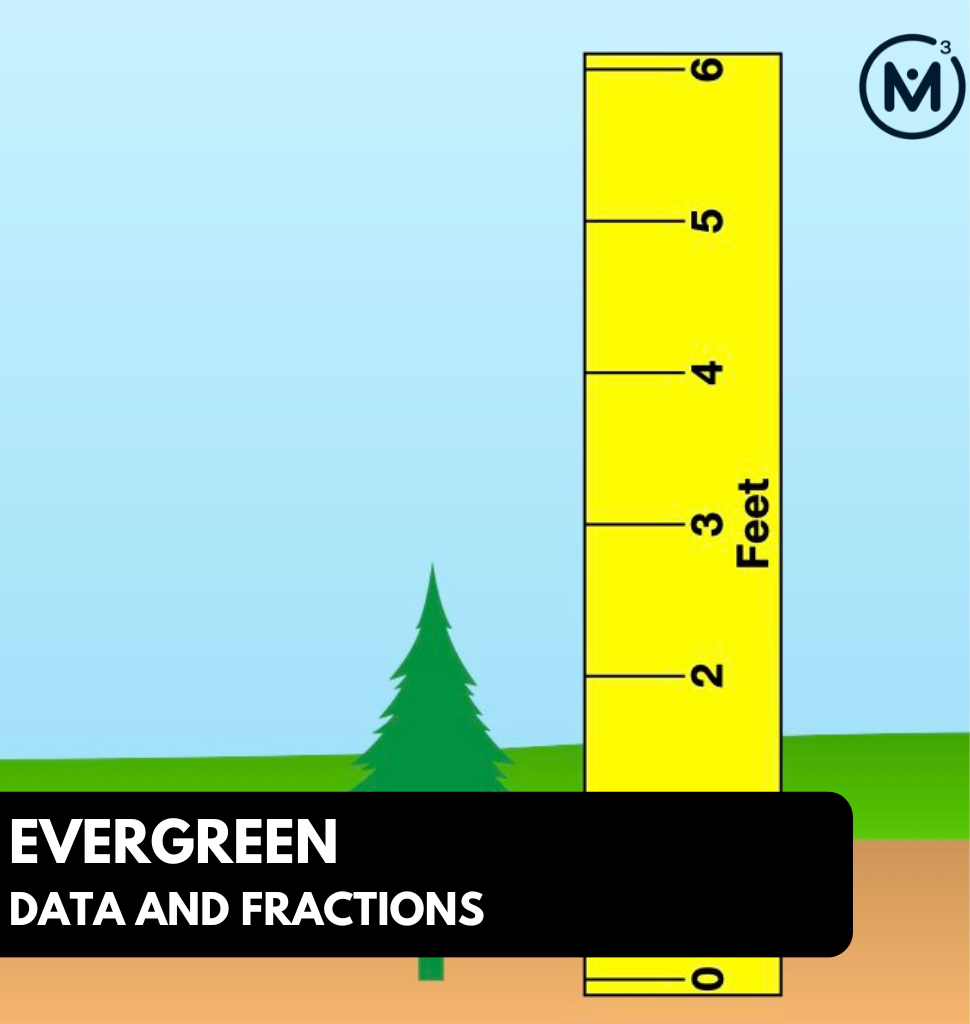
Show students the following visual math talk prompt and be prepared to pause the video where indicated:
Then ask students:
What are some possible heights for these two trees if the range in height is 1\(\frac{3}{4}\) feet?
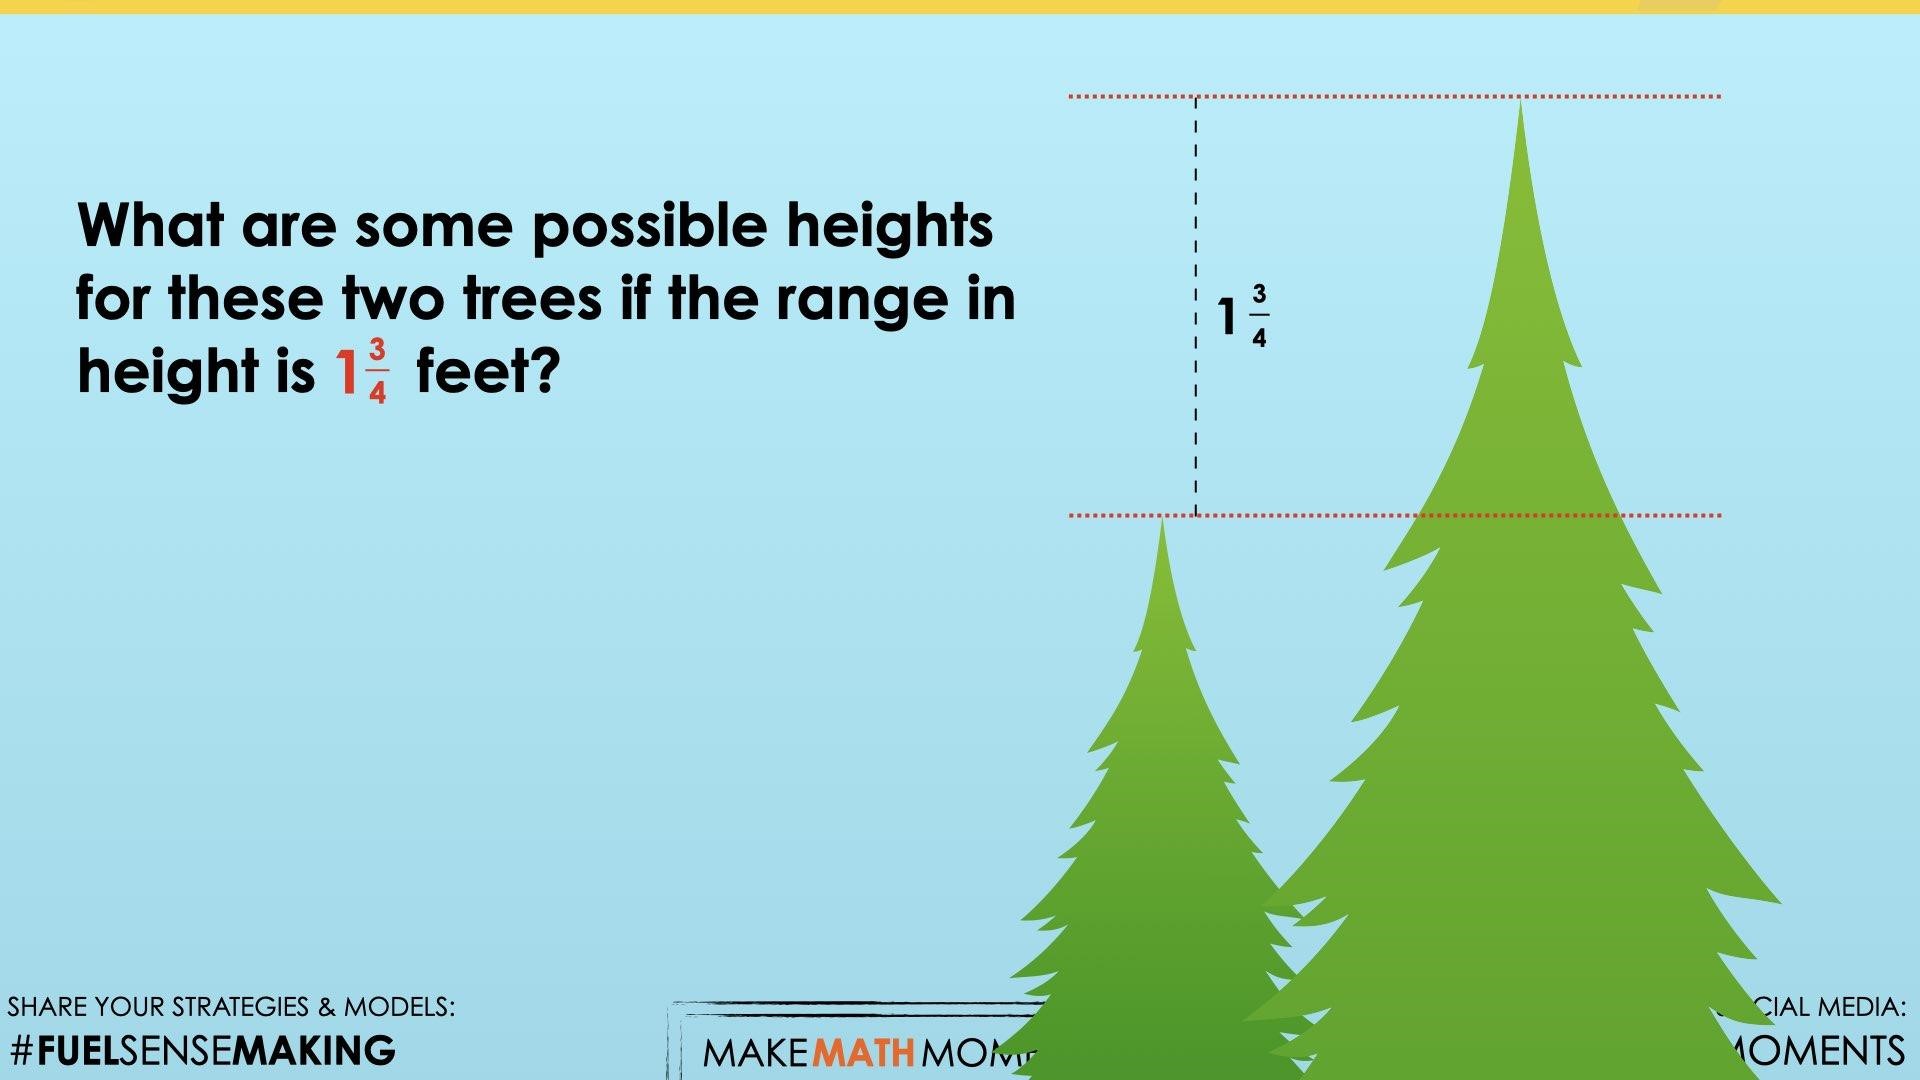
Give students some time to work through some possibilities and share them with their neighbours.
Some obvious choices would be combinations that have a whole number of feet representing the height of the shorter tree such as 2 feet so that the taller tree would simply be 1\(\frac{3}{4}\) feet taller or 3\(\frac{3}{4}\) feet. Having students who used this strategy share first would be helpful as these would be the most accessible combinations and would be easy to model for all learners.
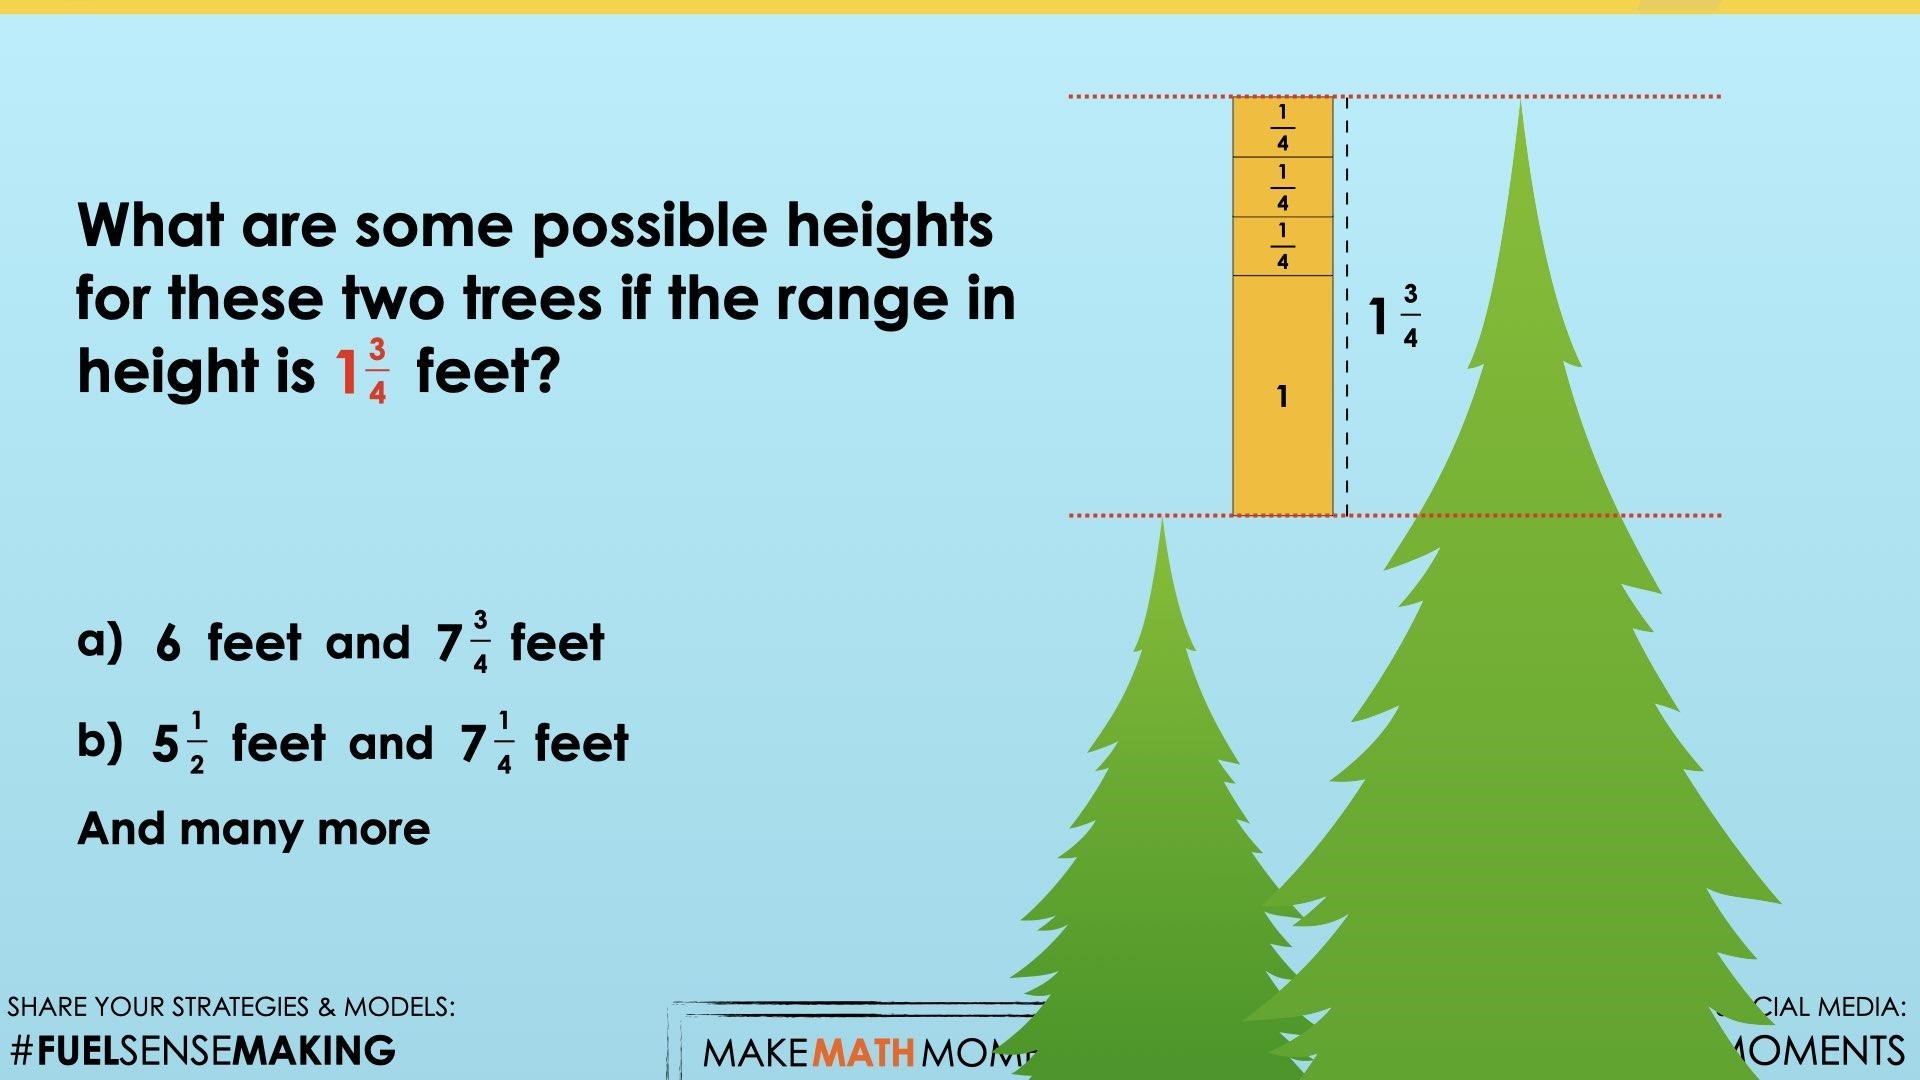
Ask other students to share other combinations where the shorter tree height is not a whole number of feet tall to encourage other possibilities that may prove to be more challenging to work through.
You might even ask students for a possibility where the taller tree is a whole number of feet, therefore requiring students to subtract 1\(\frac{3}{4}\) feet from that quantity.
Be sure to model the combinations that students share with you and encourage them to explain their thinking so you can attempt making their thinking visible.
In the visual math talk prompt video, you will see the combinations of 6 feet and 7\(\frac{3}{4}\) feet as well as 5\(\frac{1}{2}\) feet and 7\(\frac{1}{4}\) feet modelled using a tape diagram and/or linear model.
Show students the following visual math talk prompt and be prepared to pause the video where indicated:
Then ask students:
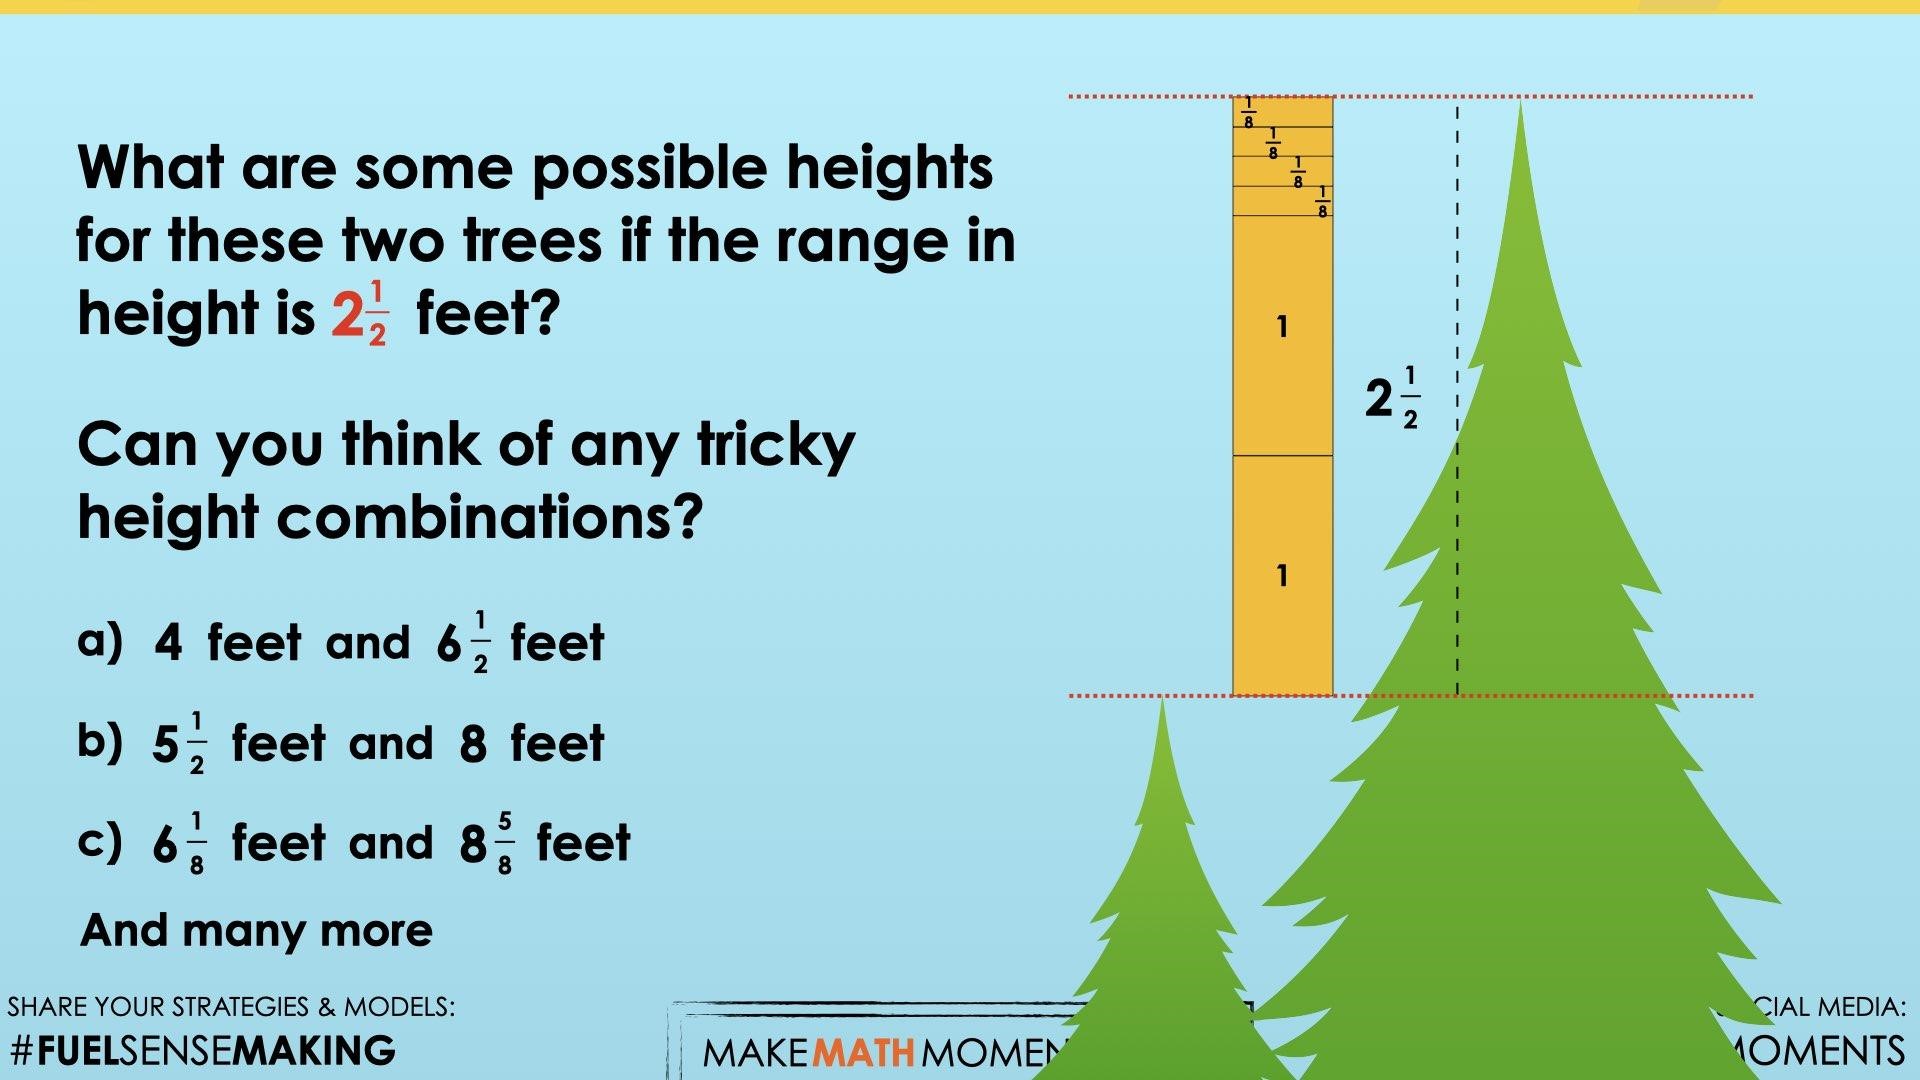
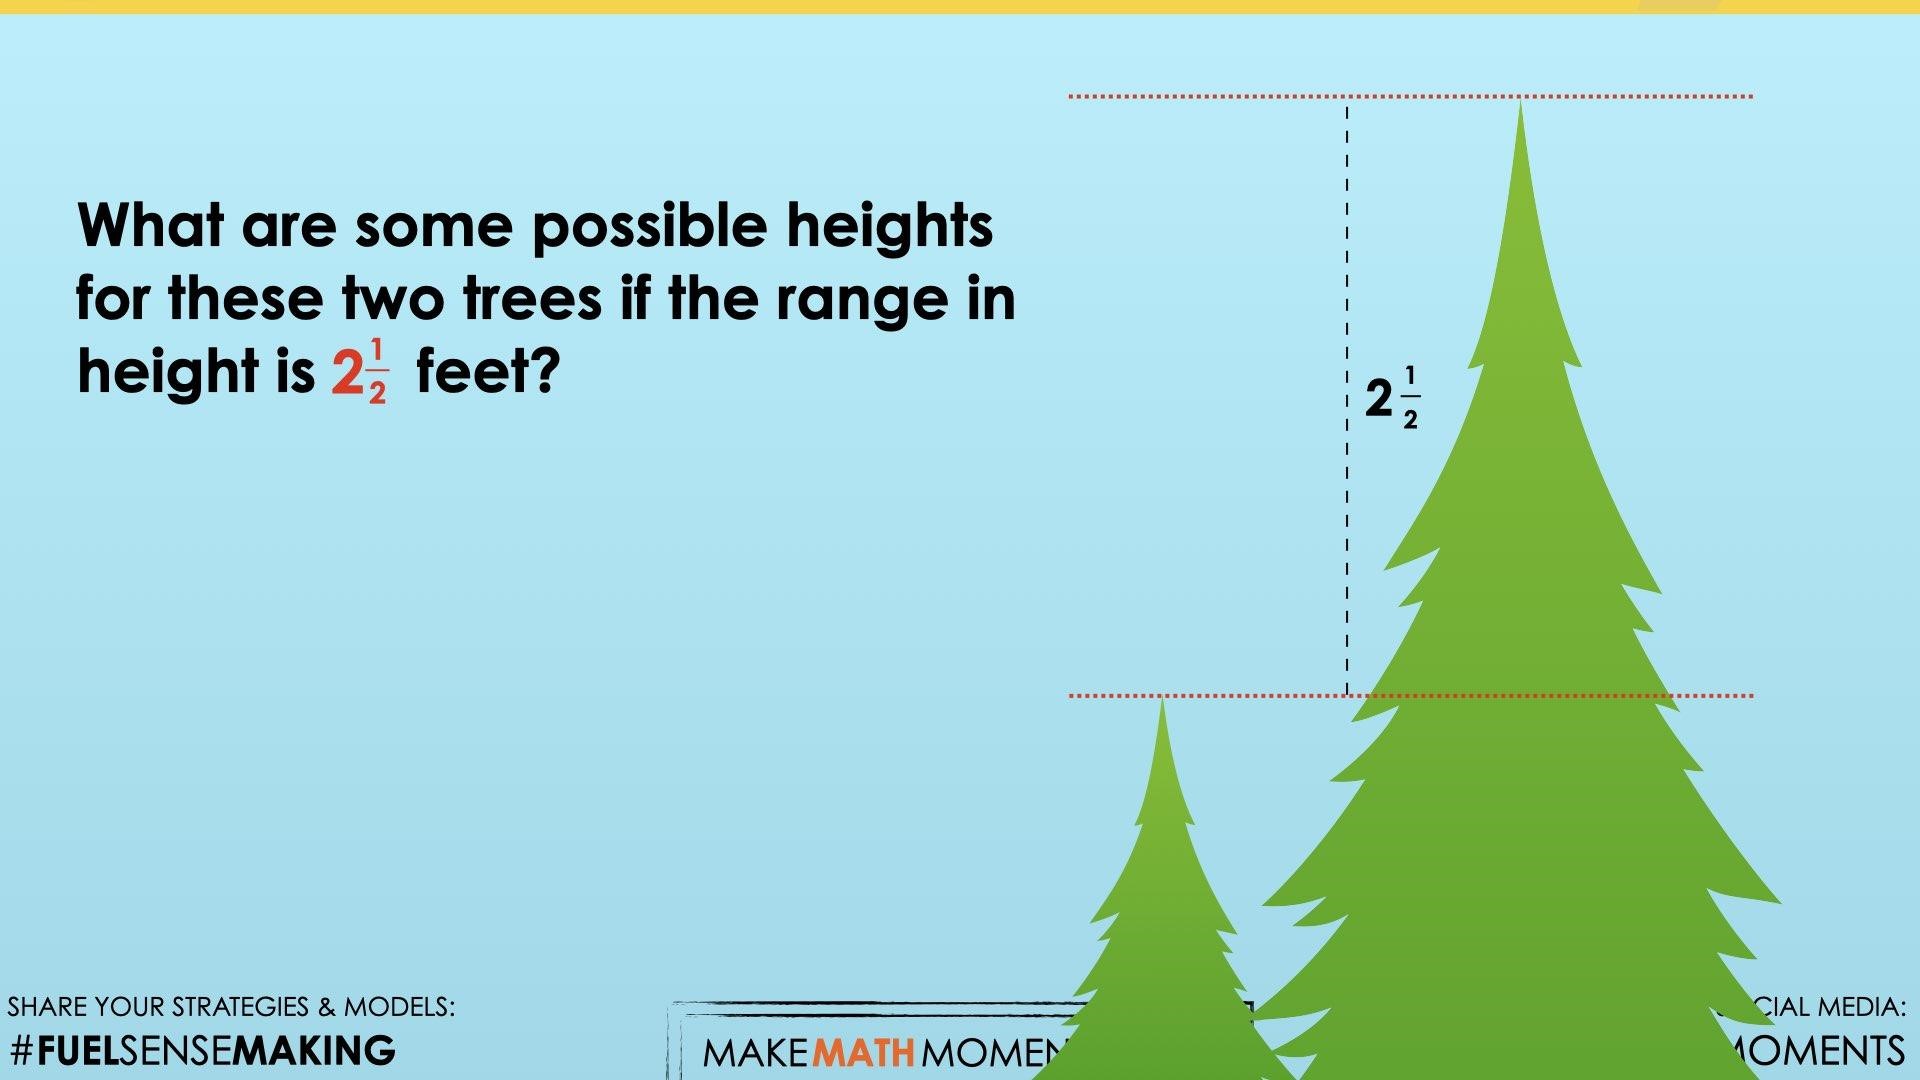
What are some possible heights for these two trees if the range in height is 2 ½ feet?
Can you think of any tricky height combinations?
As shared previously, selecting a whole number in feet to represent the height of the shorter tree would make this exercise relatively simple for some students, therefore this time we will ask them to first think of any combinations they’d like followed by some combinations they might personally feel are “tricky”.
In the silent solution visual number talk prompt video, we give examples of 4 feet and 6\(\frac{1}{2}\) feet, 5\(\frac{1}{2}\) feet and 8 feet, as well as 6\(\frac{1}{8}\) feet and 8\(\frac{5}{8}\) feet.