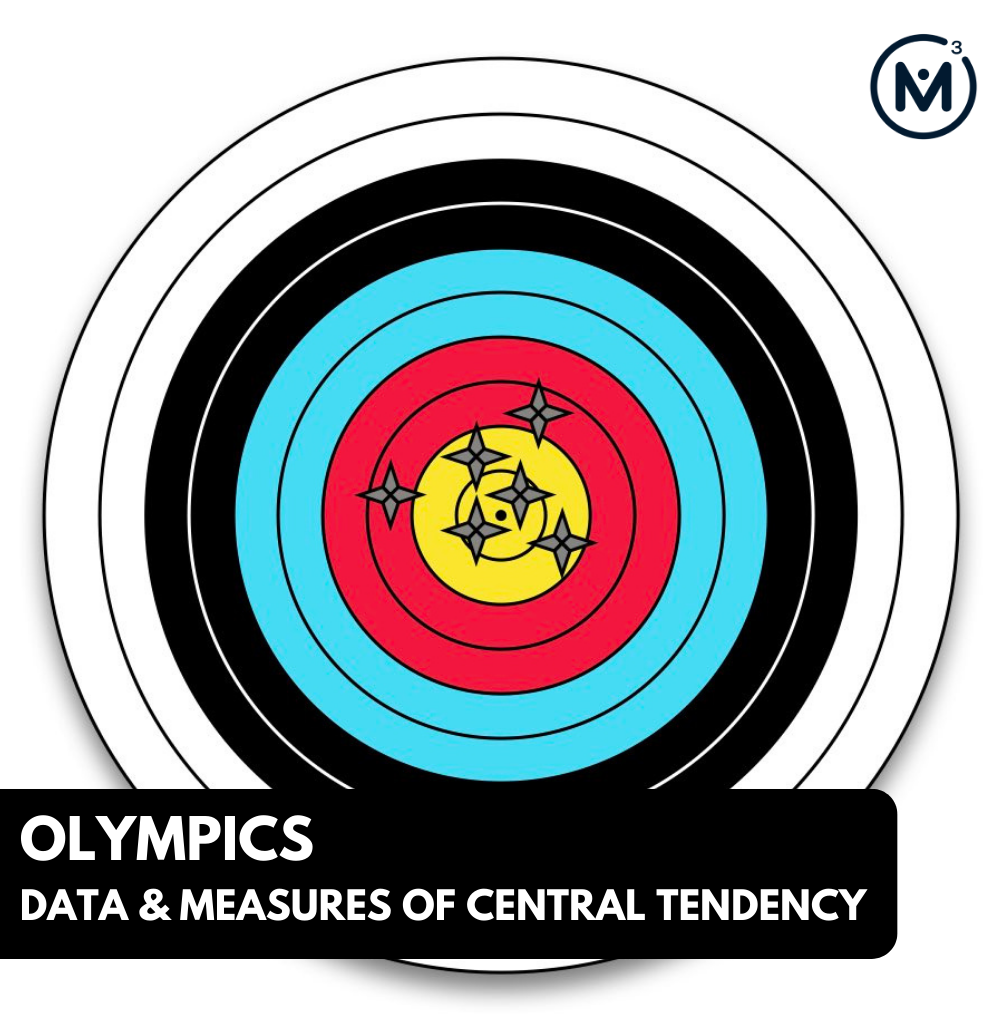
What Do You Notice? What Do You Wonder?
Show students this video:
Then, ask students:
What do you notice?
What do you wonder?

Give students 60 seconds (or more) to do a rapid write on a piece of paper.
Then, ask students to share with their neighbours for another 60 seconds.
Finally, allow students to share with the entire group.
Some of the noticing and wondering that came up in a class recently included:
- I notice a target.
- I notice arrows landing on the target.
- I notice points on the side.
- I notice the first arrow was 9 points.
- I wonder if this is the same person shooting the arrows or different people.
- I wonder how you win.
- I wonder how many points they will get.
- And many more.
At this point, you can answer any notices and wonders that you can cross off the list right away.
Next, verbally share the following information and share the visual prompt at the same time:
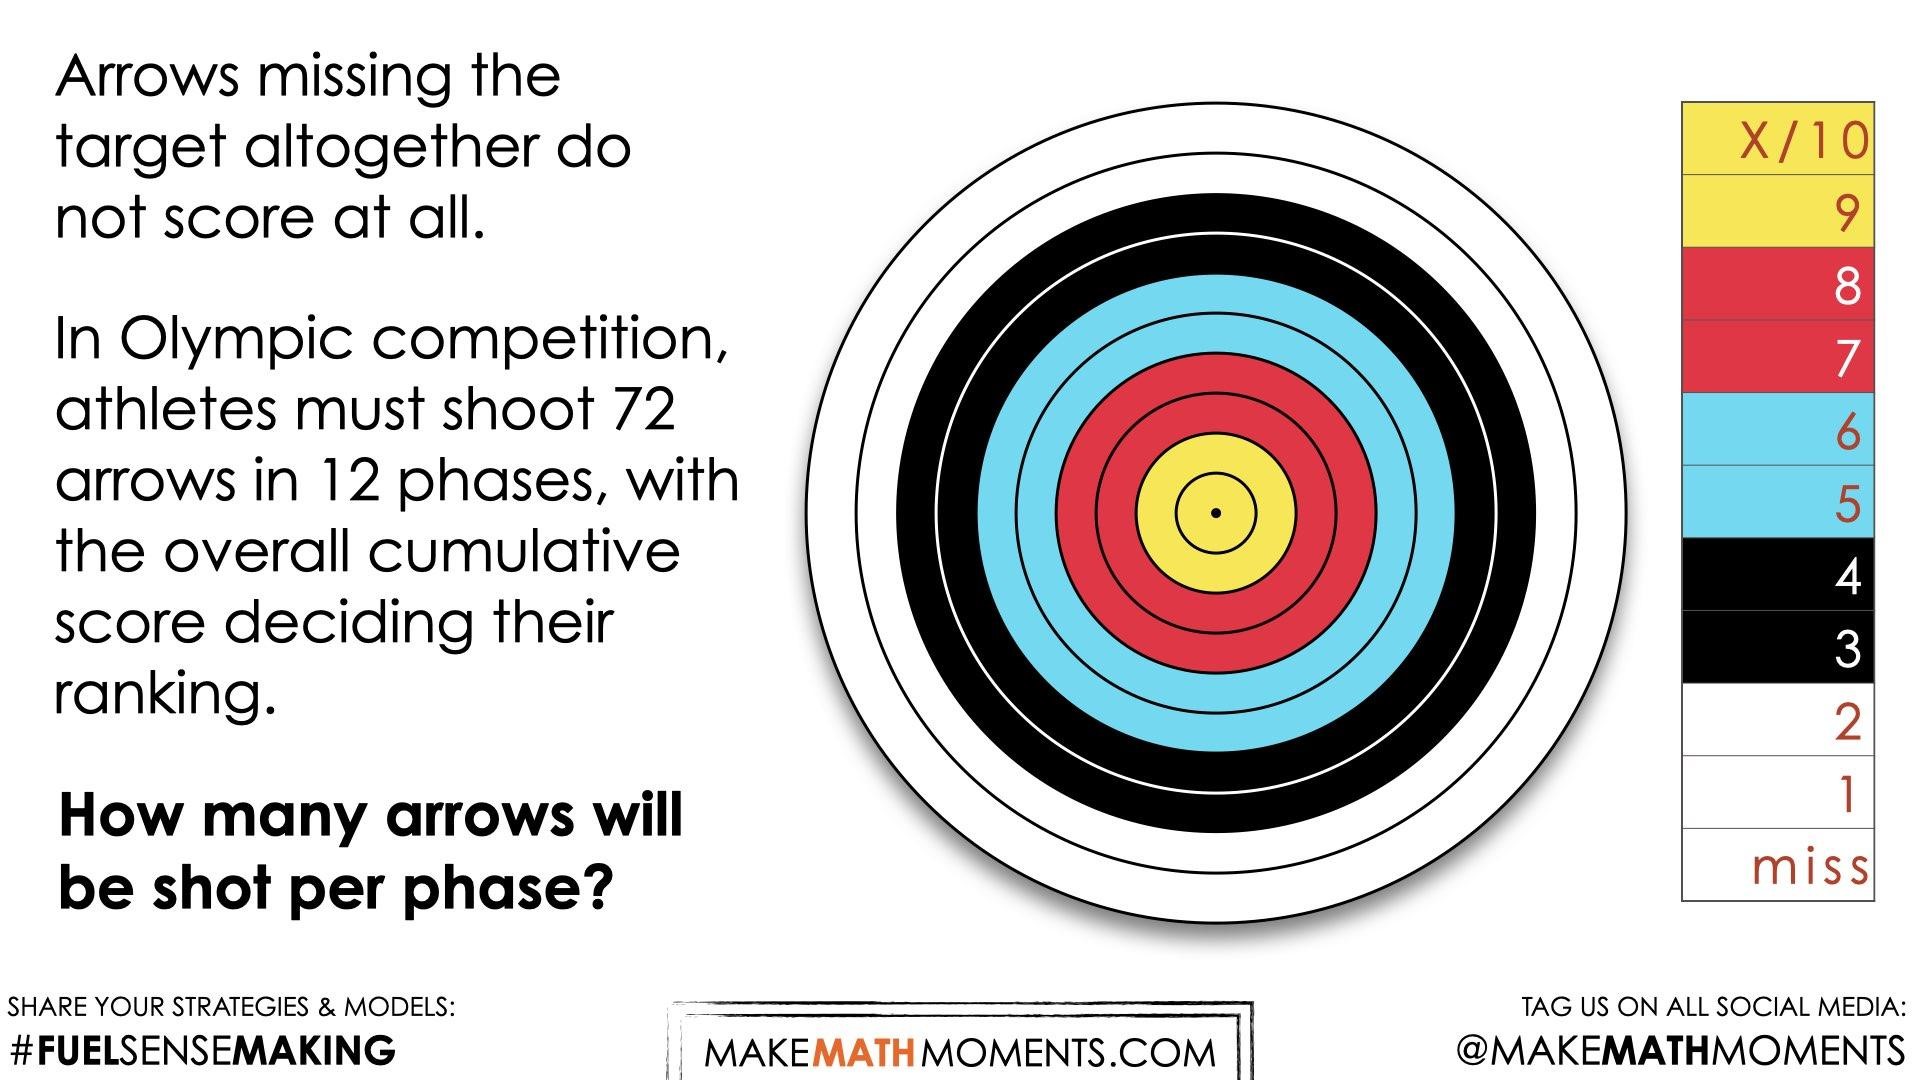
Scoring in archery is simple: just add up the number of points based on where your arrows hit the target.
The highest score for a single arrow is 10 for hitting the inner gold ring and one point for hitting the outer white ring. Arrows missing the target altogether do not score at all.
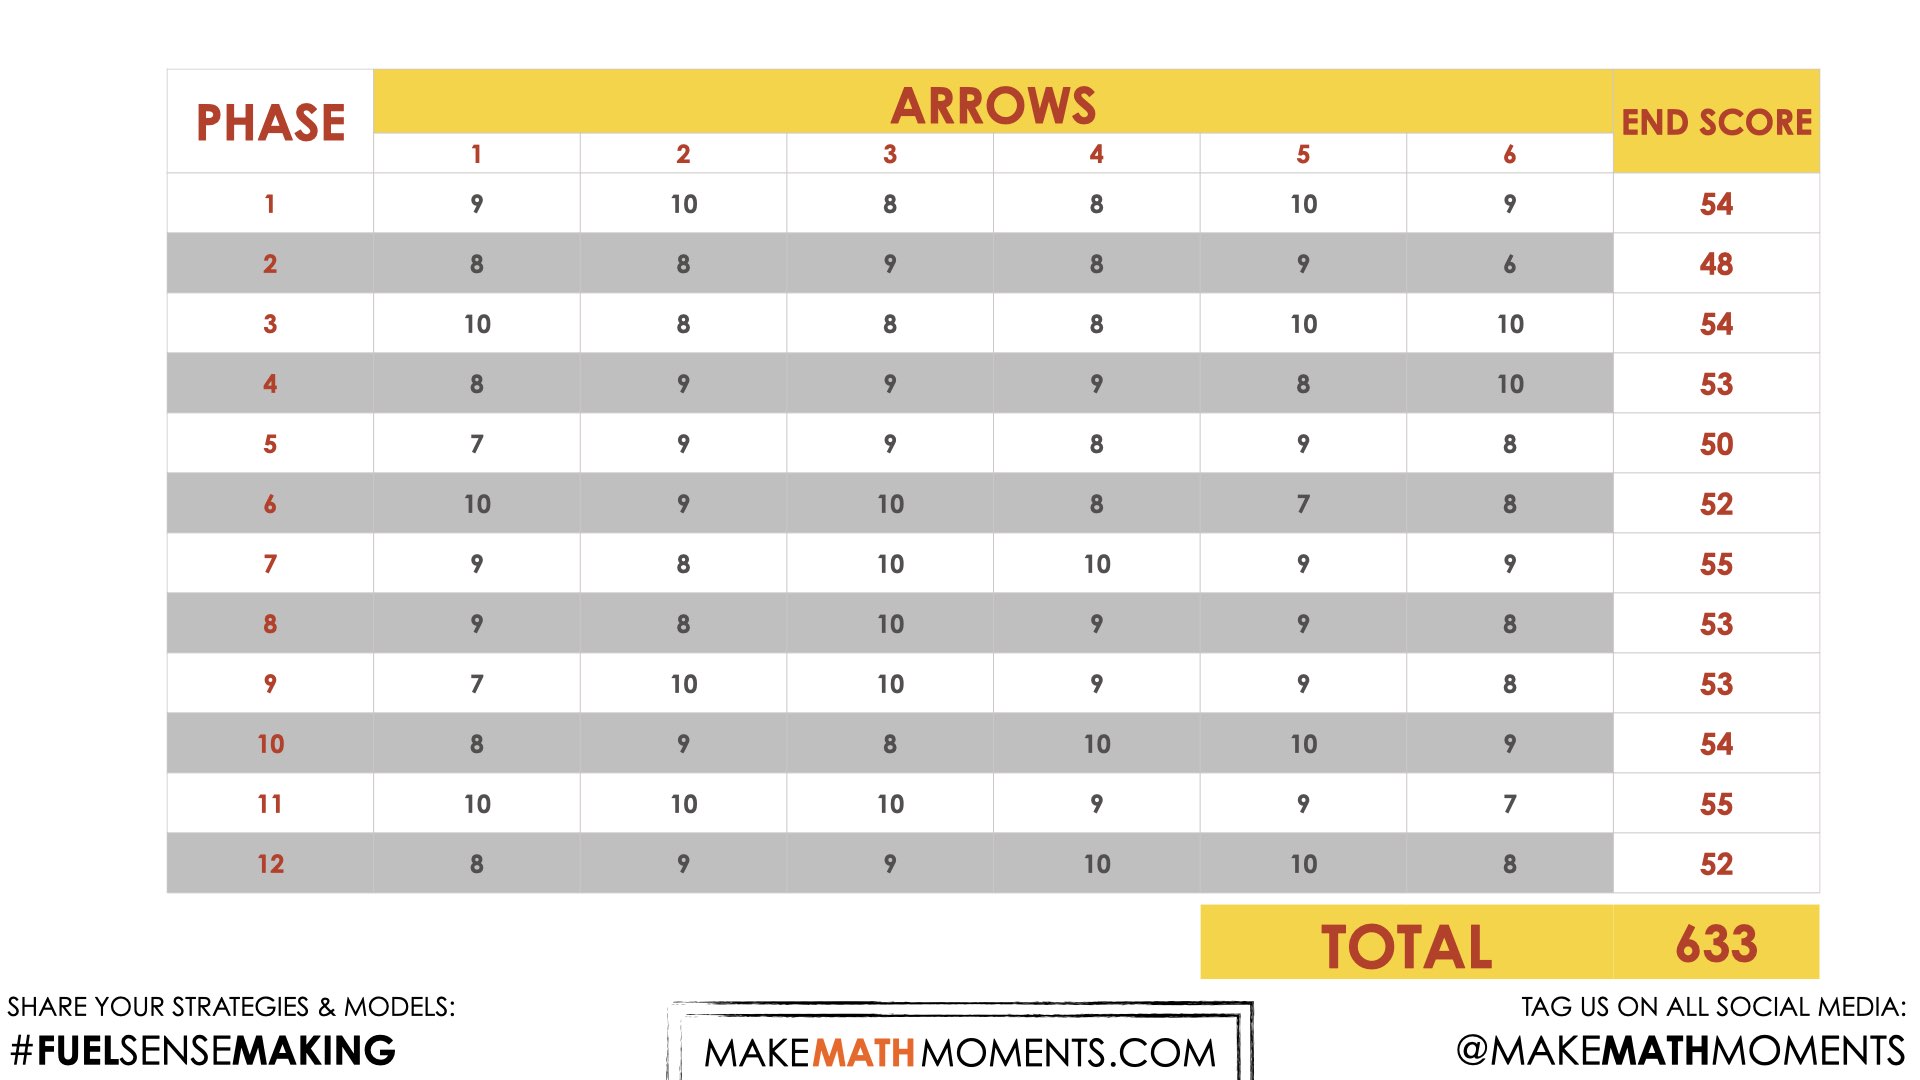
In Olympic competition athletes must shoot 72 arrows over 12 phases, with the overall cumulative score deciding their ranking
Share the following Spark Prompt with students:
If each archer must shoot 72 arrows altogether over 12 phases, how many arrows are shot per phase?
Spark Prompt Reveal
Share the following silent reveal video that quickly reveals all 72 shots over 12 phases:
Students will see that there are 6 arrows shot per phase.
Estimation: Prompt
Next, we can share the following estimation prompt with students:
After seeing the 6 arrows shot during phase 1, what do you anticipate this archer’s cumulative score to be at the end of all 12 phases?
Make an estimate.
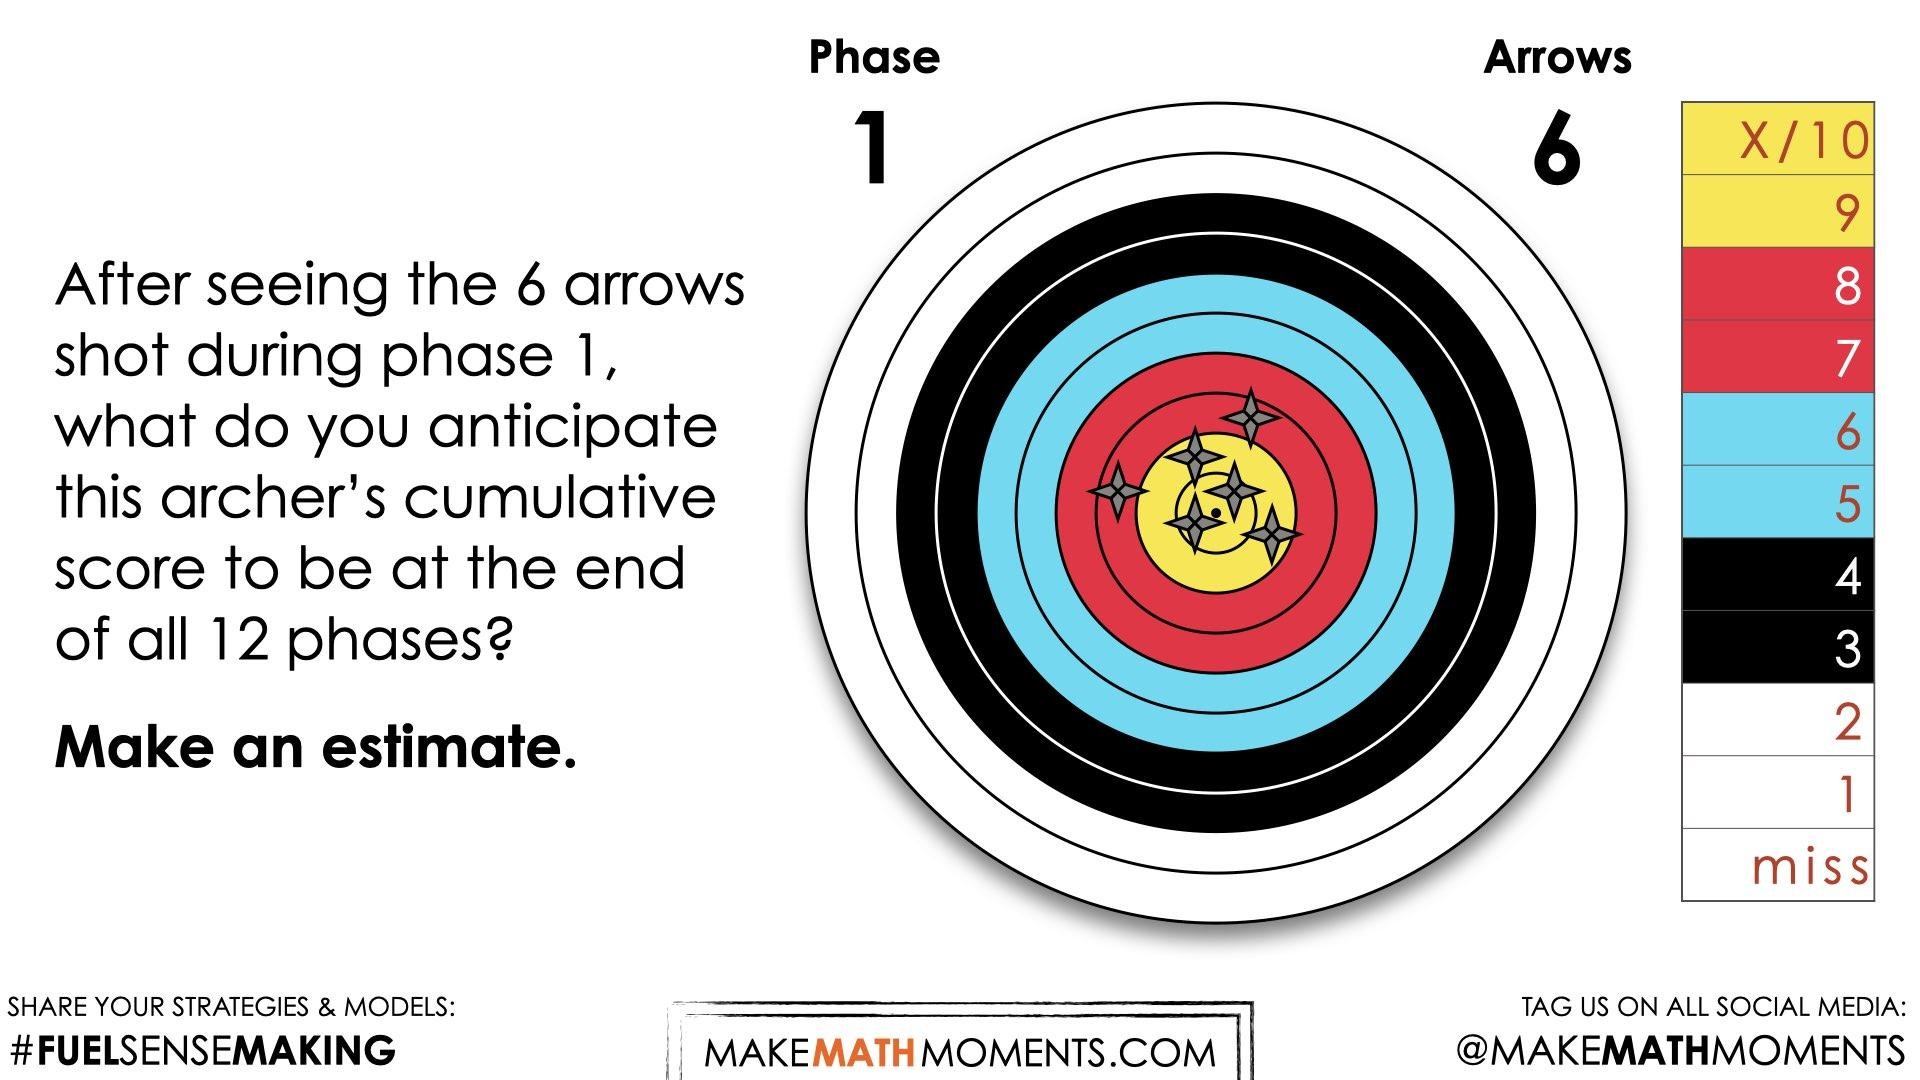
We can now ask students to make an estimate (not a guess) as we want them to be as strategic as they can possibly be. This will force them to use reasoning to try and come up with a reasonable estimate for 72 arrows. Students may even begin using a measure of central tendency for phase one to determine a reasonable cumulative score.
Consider asking students to think about a number that would be “too low” and a number that would be “too high” before asking for their best estimate in order to help them come up with a more reasonable estimate.
Let them chat with their neighbours and challenge them to an estimation duel or a math fight.
While Students Are Estimating…
Monitor student thinking by circulating around the room and listening to the mathematical discourse. Encourage students to use precise mathematical language and listen for the use of measures of central tendency. If students do not consider how many points the archer usually scores in one shot, you may nudge them in this direction through questioning. About how many points does the archer typically score in a single shot? What is his most consistent point value?
Allow students to share their estimates with neighbours first, then with the class. Write down their estimates on the chalkboard/whiteboard/chart paper so students feel their voices are being heard and so they feel they have a stake in solving this problem. At this point, highlight the idea of using a single value to summarize the archers points earned per shot and how this information might be helpful.
Tell students that you will not be sharing the exact score just yet.
Crafting A Productive Struggle:
Since you have already taken some time to set the context for this problem and student curiosity is already sparked, we have them in a perfect spot to help push their thinking further and fuel sense making.
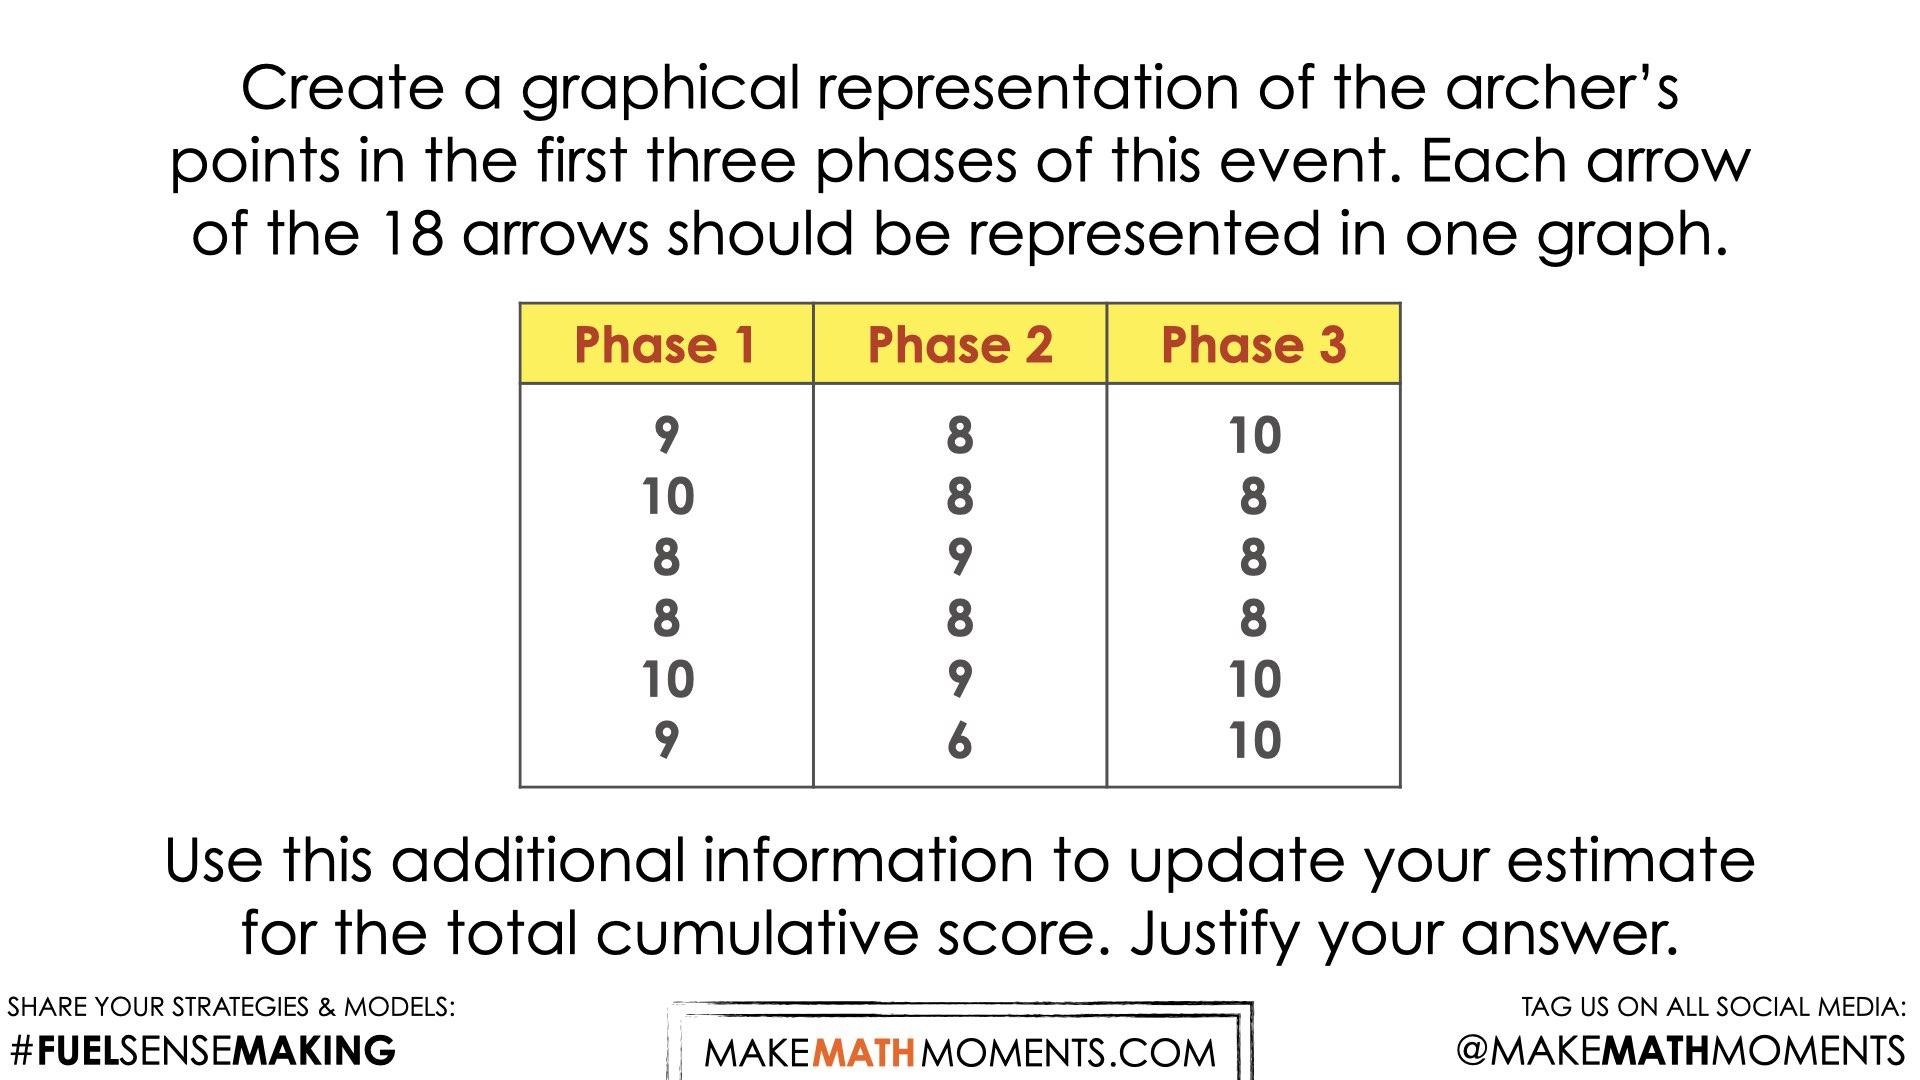
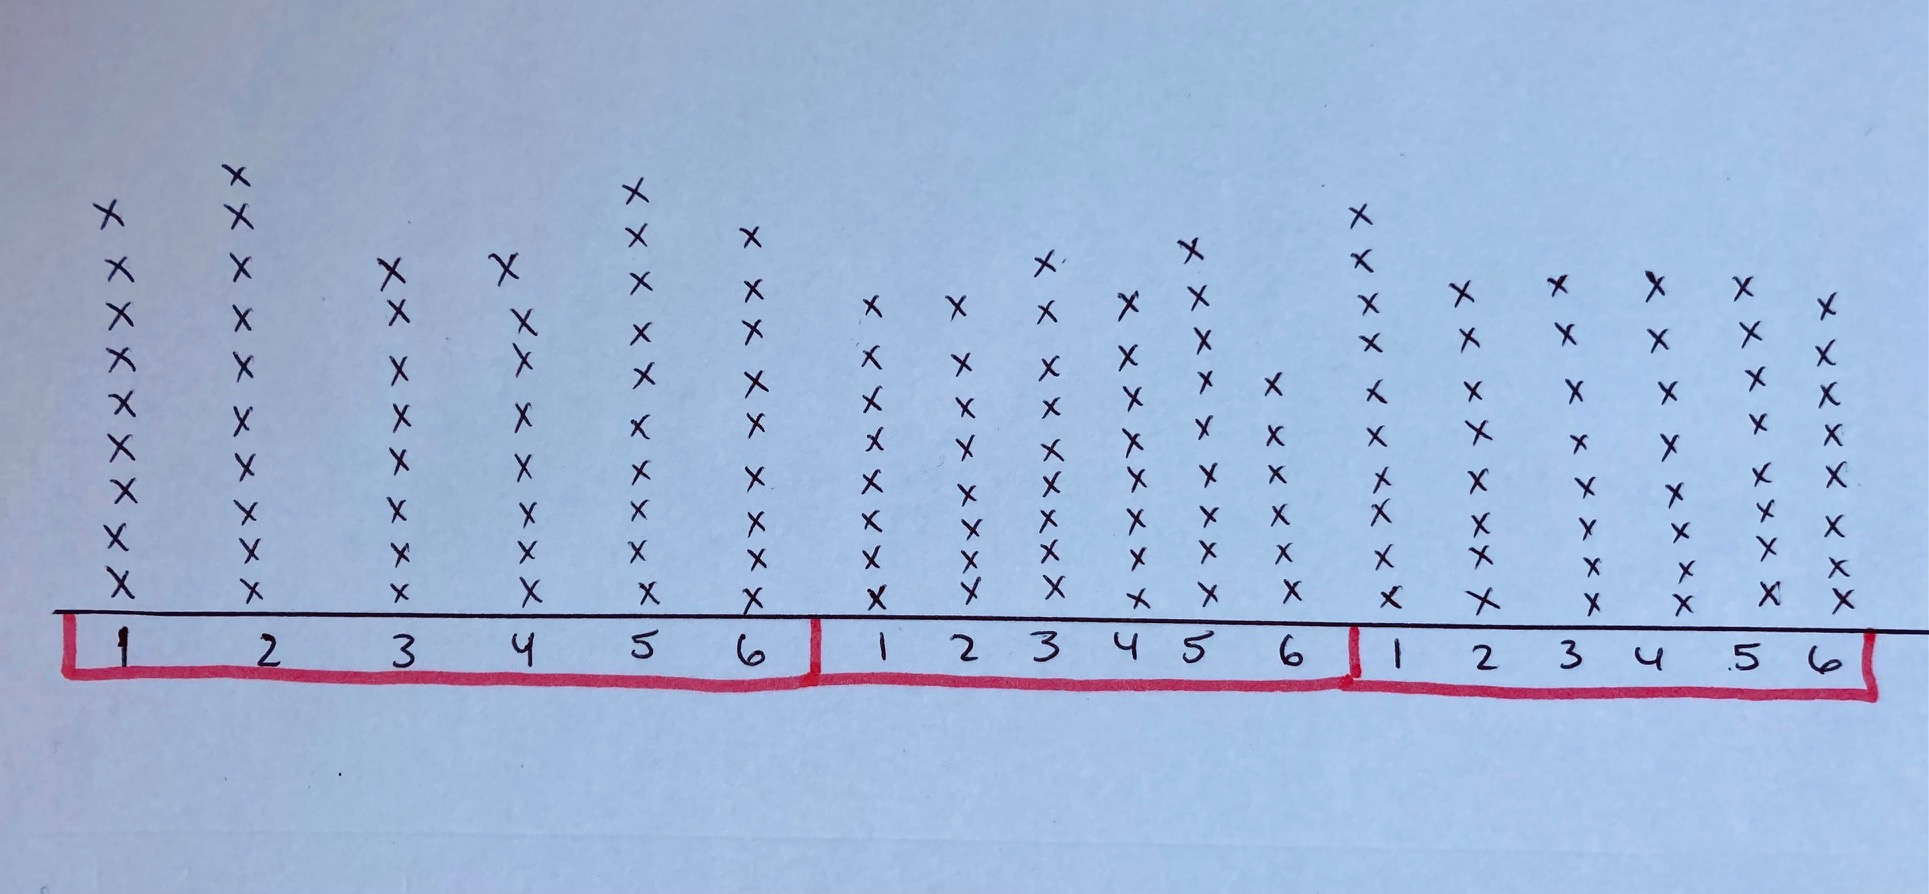
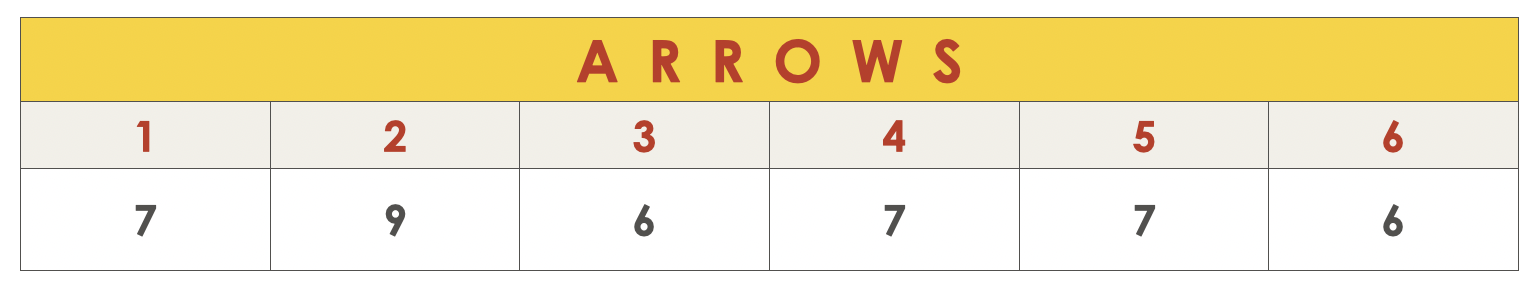
Share the archer’s points for the first three phases of this event via this animation:
You can verbally share the following information with students also:
Create a graphical representation of the archer’s points in the first three phases of this event. Each arrow of the 18 arrows should be represented in one graph.
Use this additional information to update your estimate for the total cumulative score. Justify your answer.
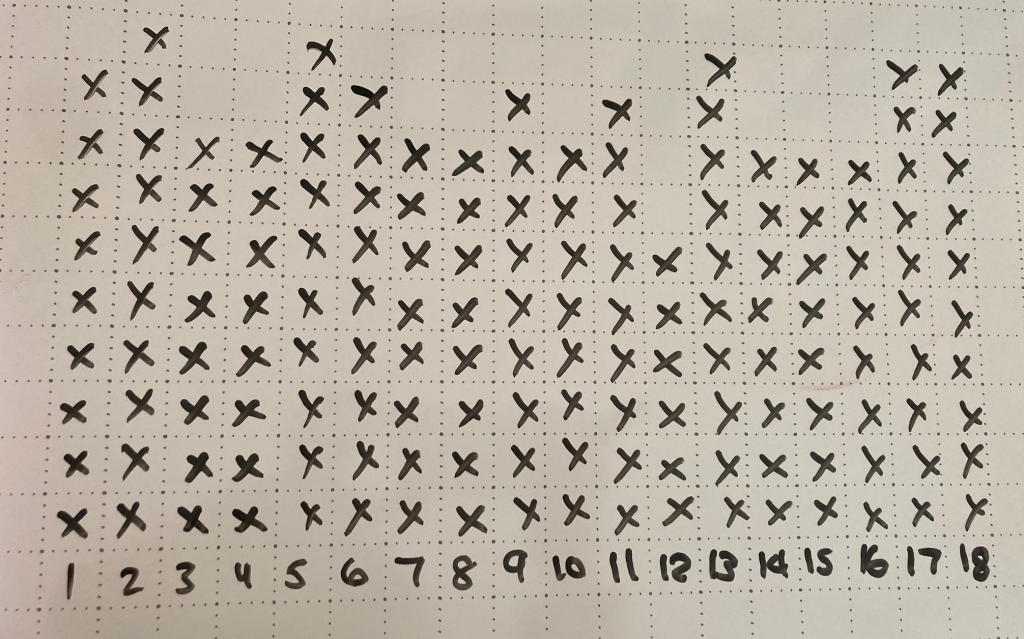
Student Approach #1: Line plot and mode
I decided to create a line plot to represent the score for each arrow. Then I noticed that the number of points that appeared the most was 8. So I guessed that he was going to score eight points a lot in the future phases. Let’s say that every arrow was 8 points, 72 multiplied by 8 is 576 points. That is my new estimate.
Student Approach #2: Line plot and mean
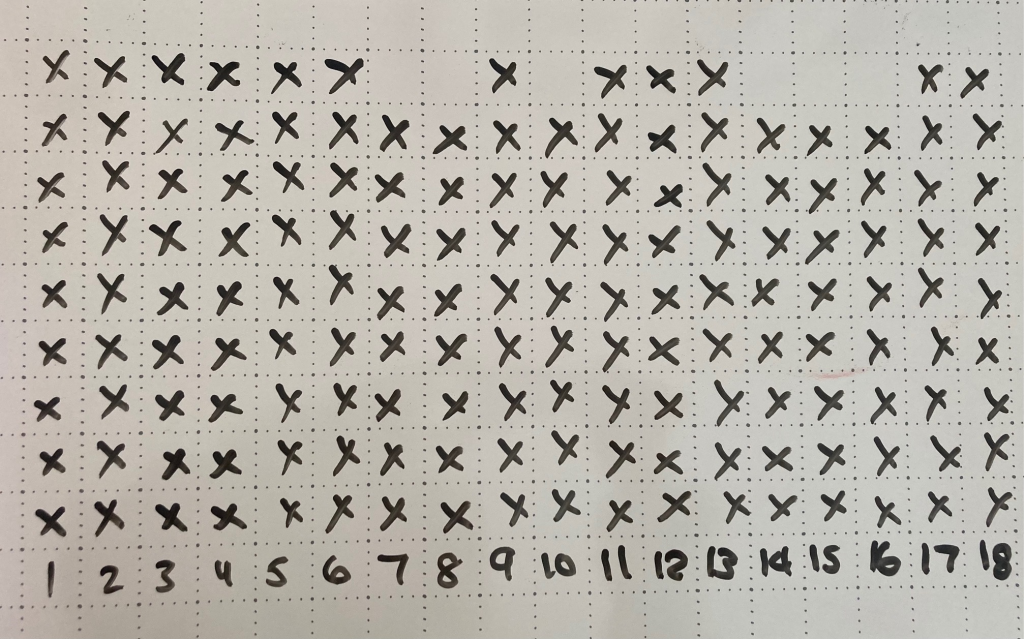
I used a line plot to represent the points for each arrow. Each x represents one point. I decided to rearrange the points so that all of the rows were as even as I could get them. I noticed that most of my rows had nine points. 72 multiplied by 9 is 648. I updated my estimate to 640 because not all rows have nine points.
Student Approach #3: Digital bar graph and mean
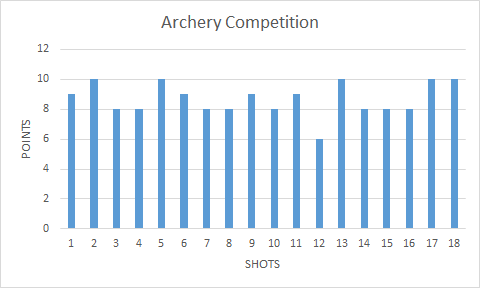
I used excel to make a bar graph. Then I took all the individual points in each phase and added them up. I added the scores for the three phases (54 + 48 + 54), and then divided the total by three to find out how many points per phase. It was on average 52 points per phase. I multiplied 52 by 12, and that gave me an estimated total score of 624 points.
Reveal
Show students the following reveal video animation:
Alternatively, you could simply show the final scorecard image below.
Provide students an opportunity to reflect on their learning by offering these consolidation prompts to be completed independently.
Consolidation Prompt #1:
Determine a single value to summarize the points scored with one arrow by the following archer in phase.
Justify your answer.
Consolidation Prompt #2:
The data set shared today was an example of discrete data.
- In your own words, define discrete data.
- Share another example of discrete data.
We suggest collecting this reflection as an additional opportunity to engage in the formative assessment process to inform next steps for individual students as well as how the whole class will proceed.