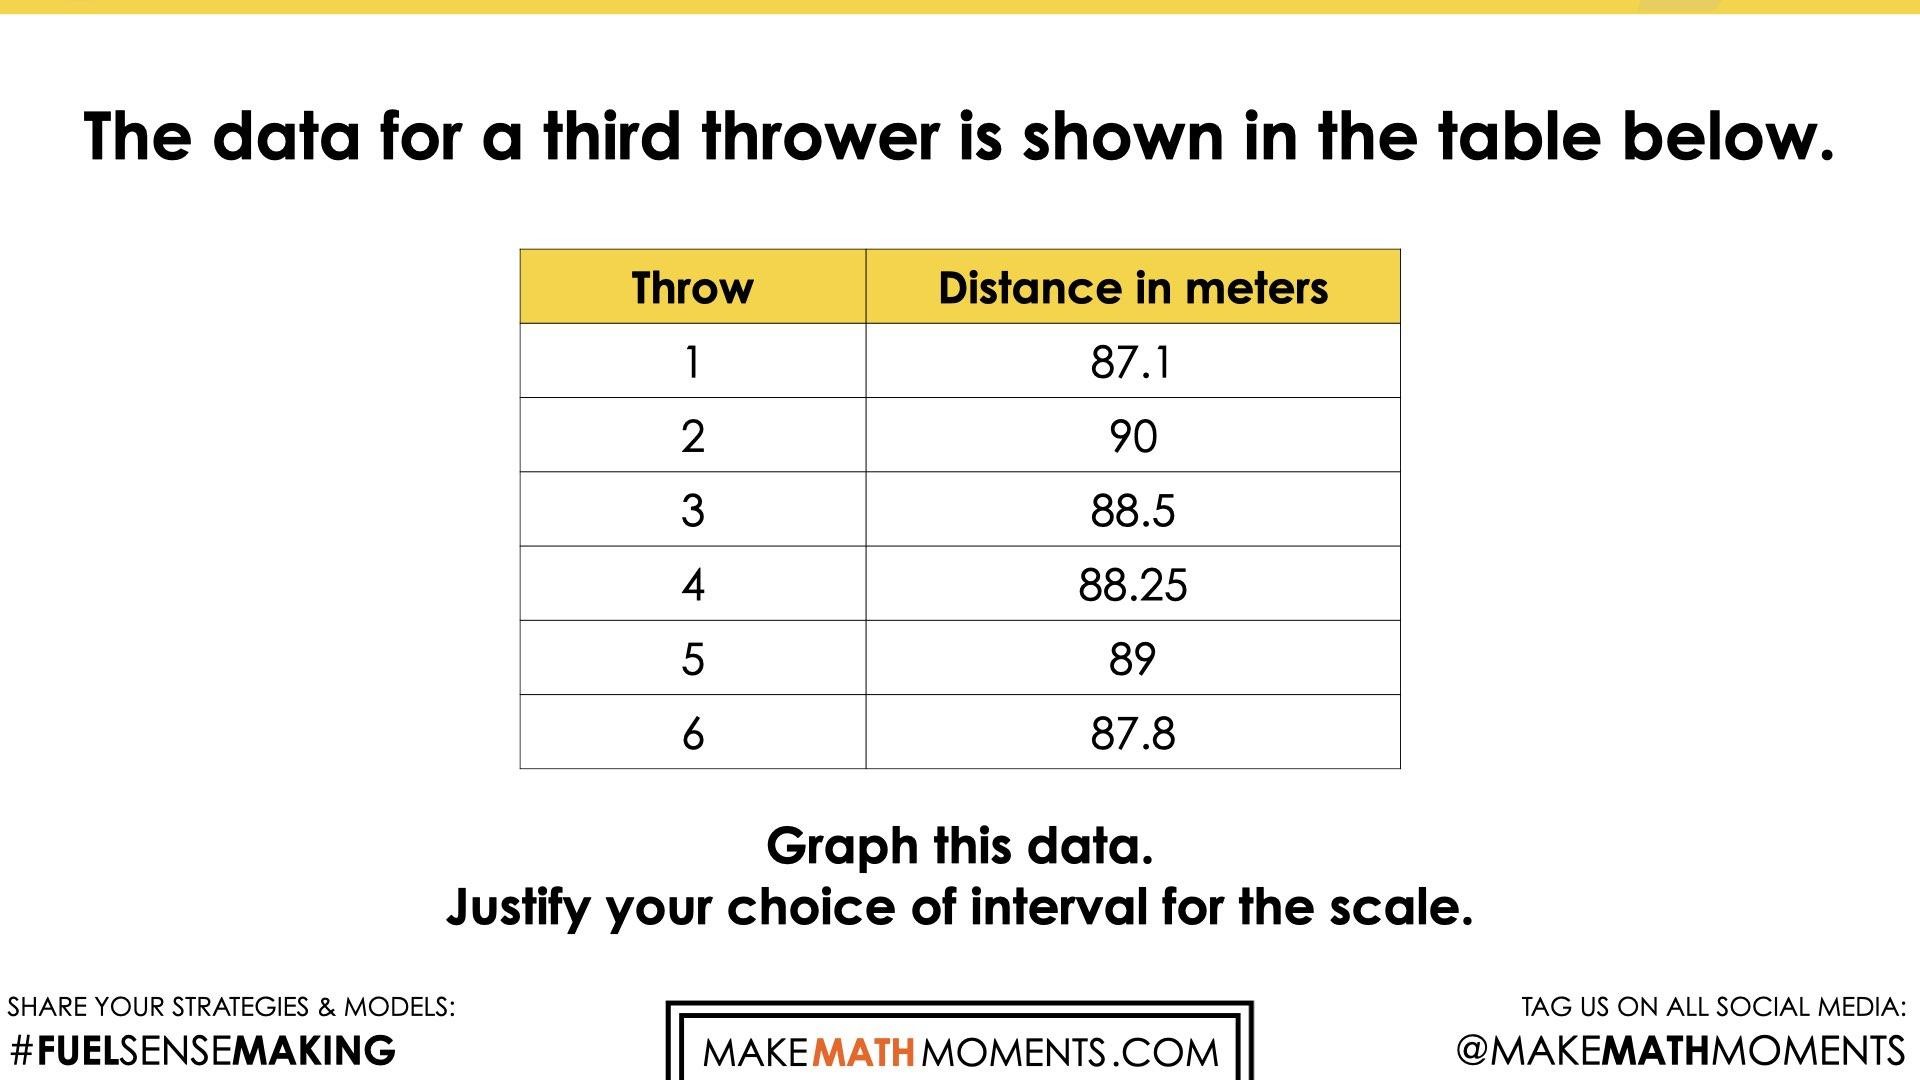
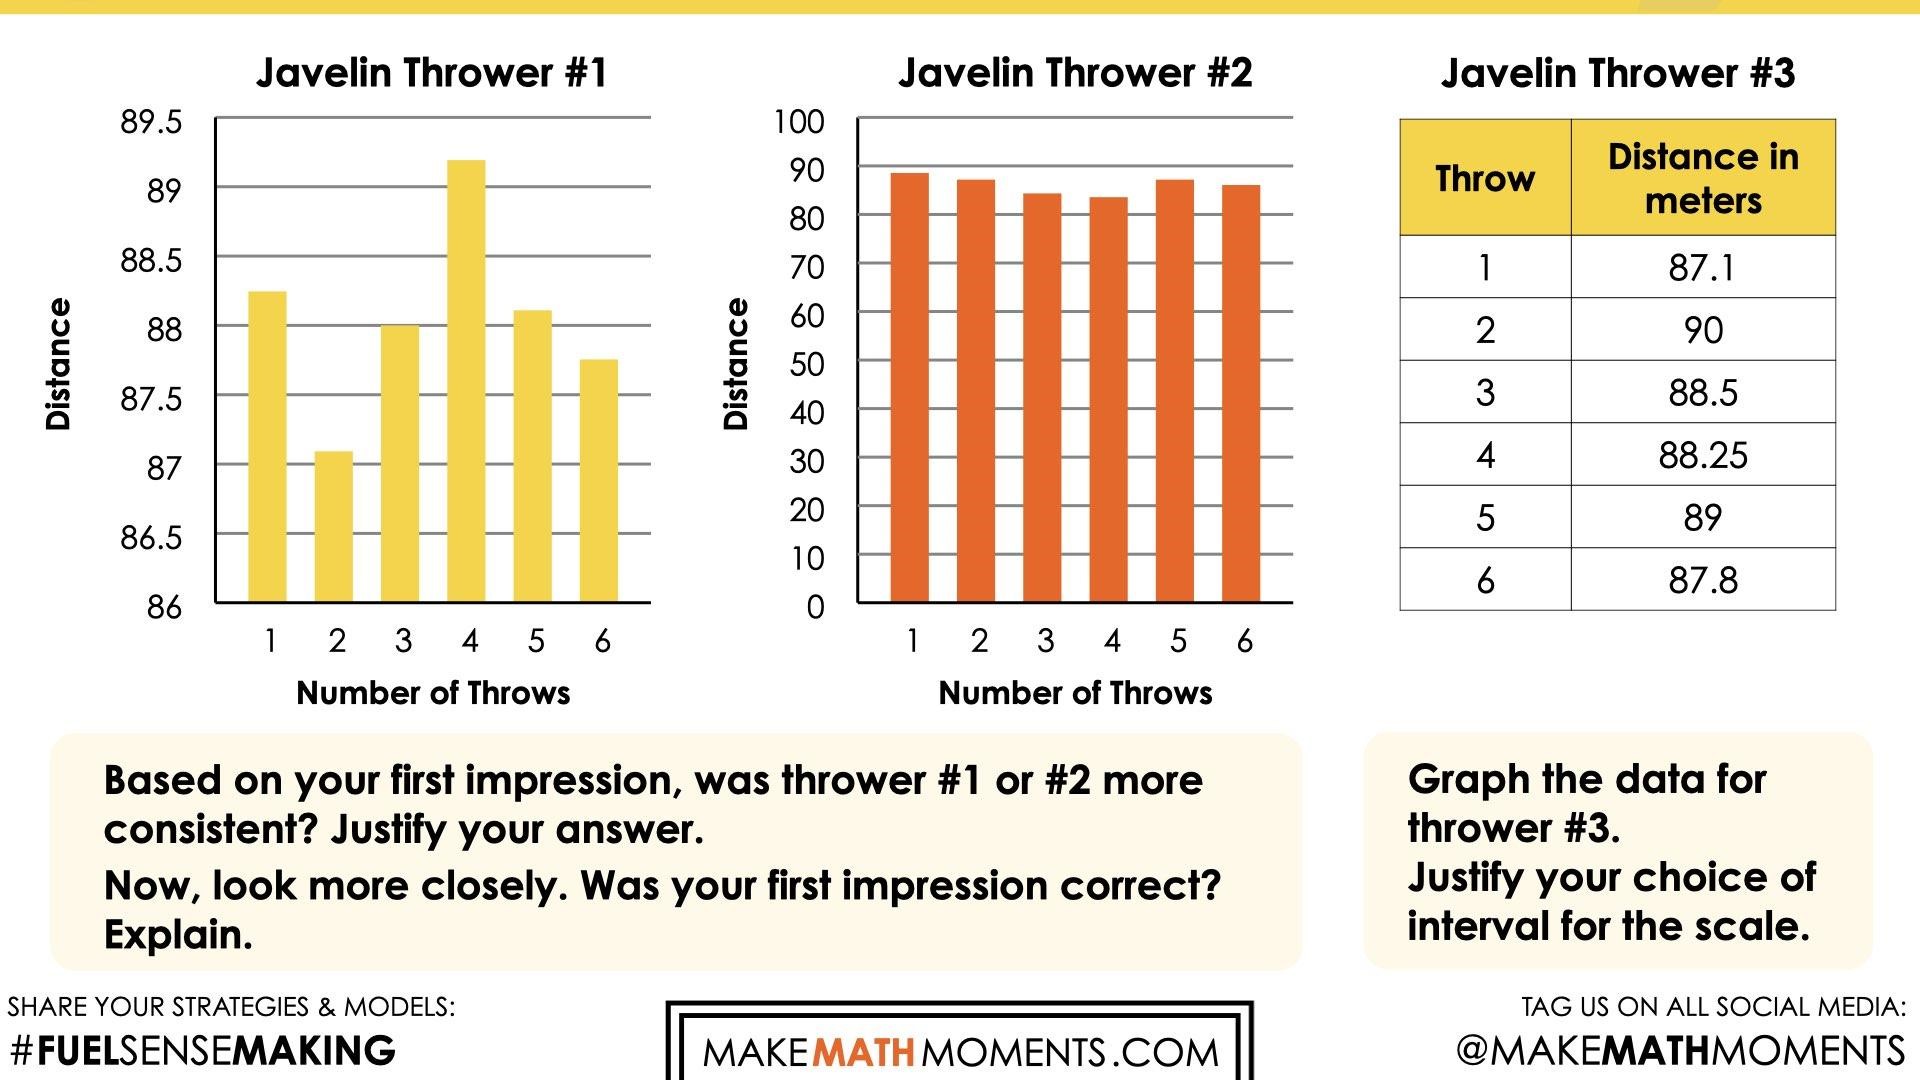
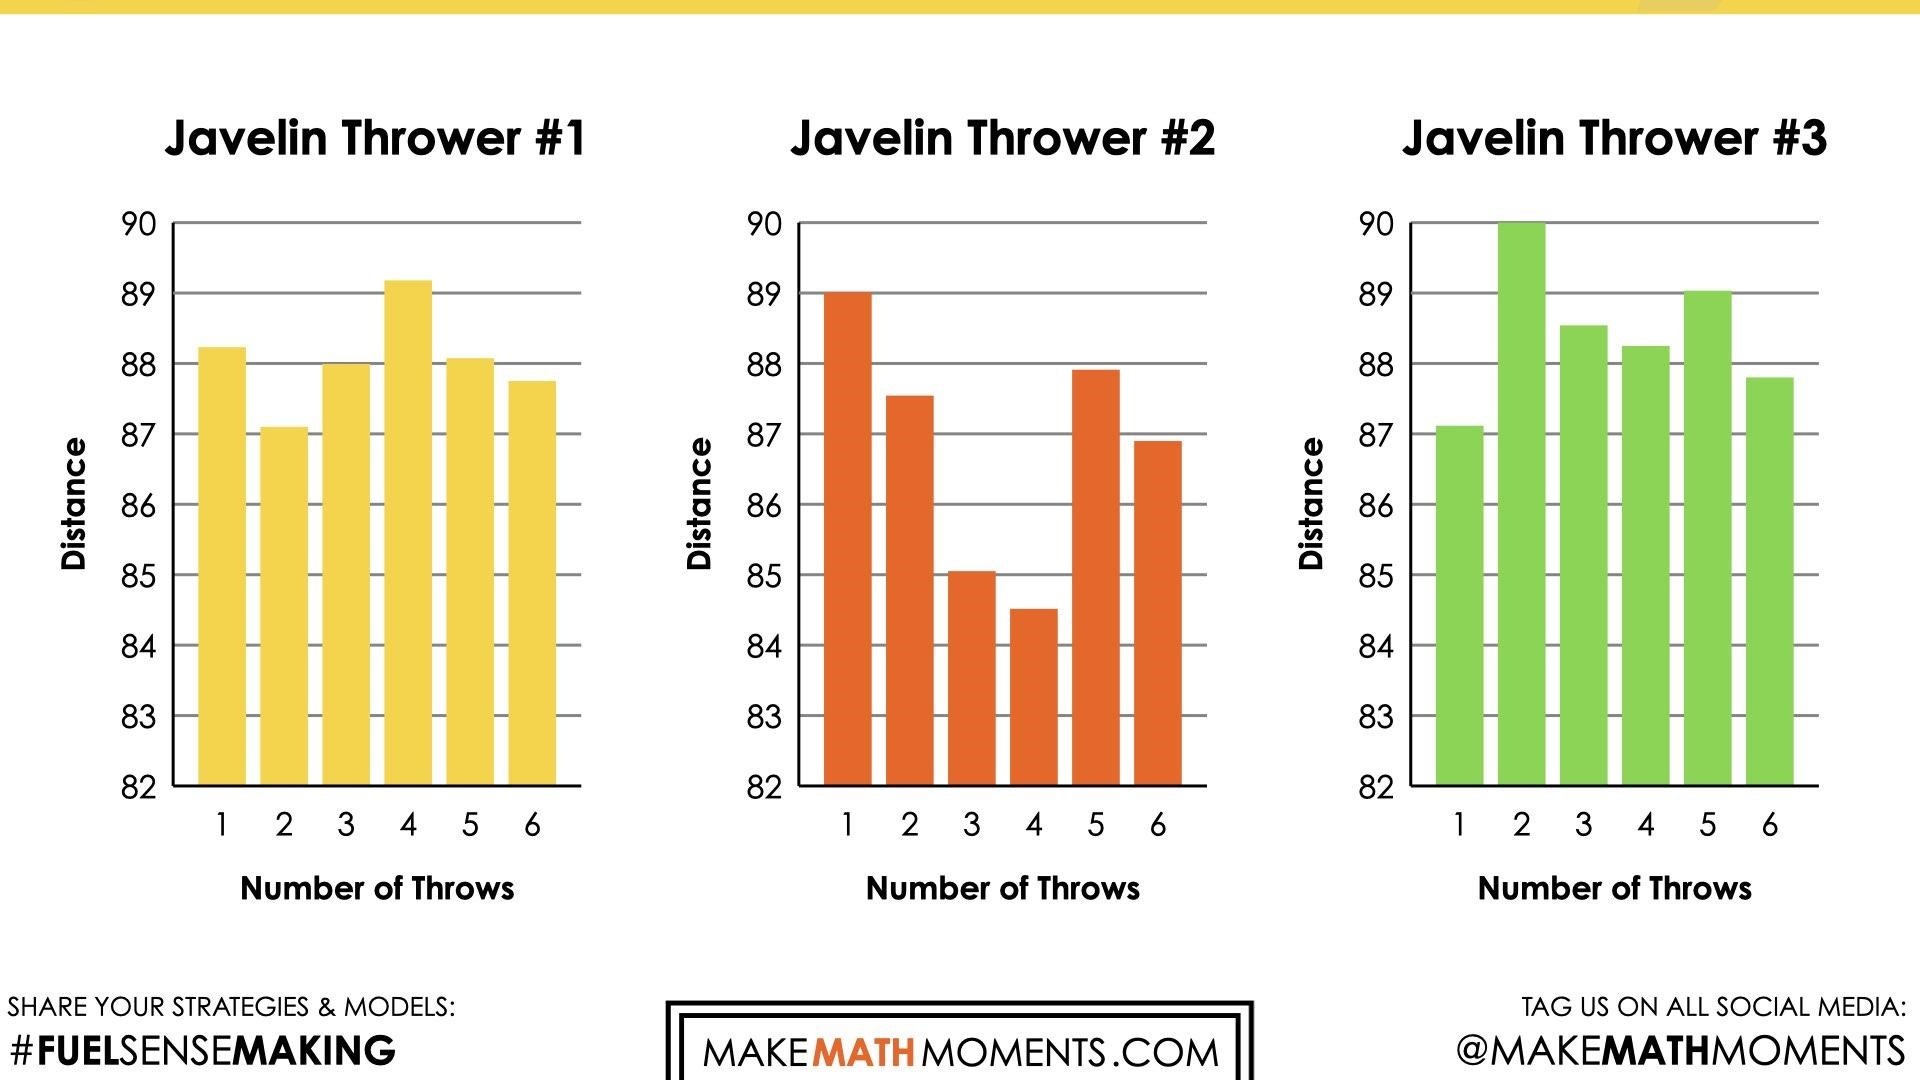
Consolidation Prompt #1
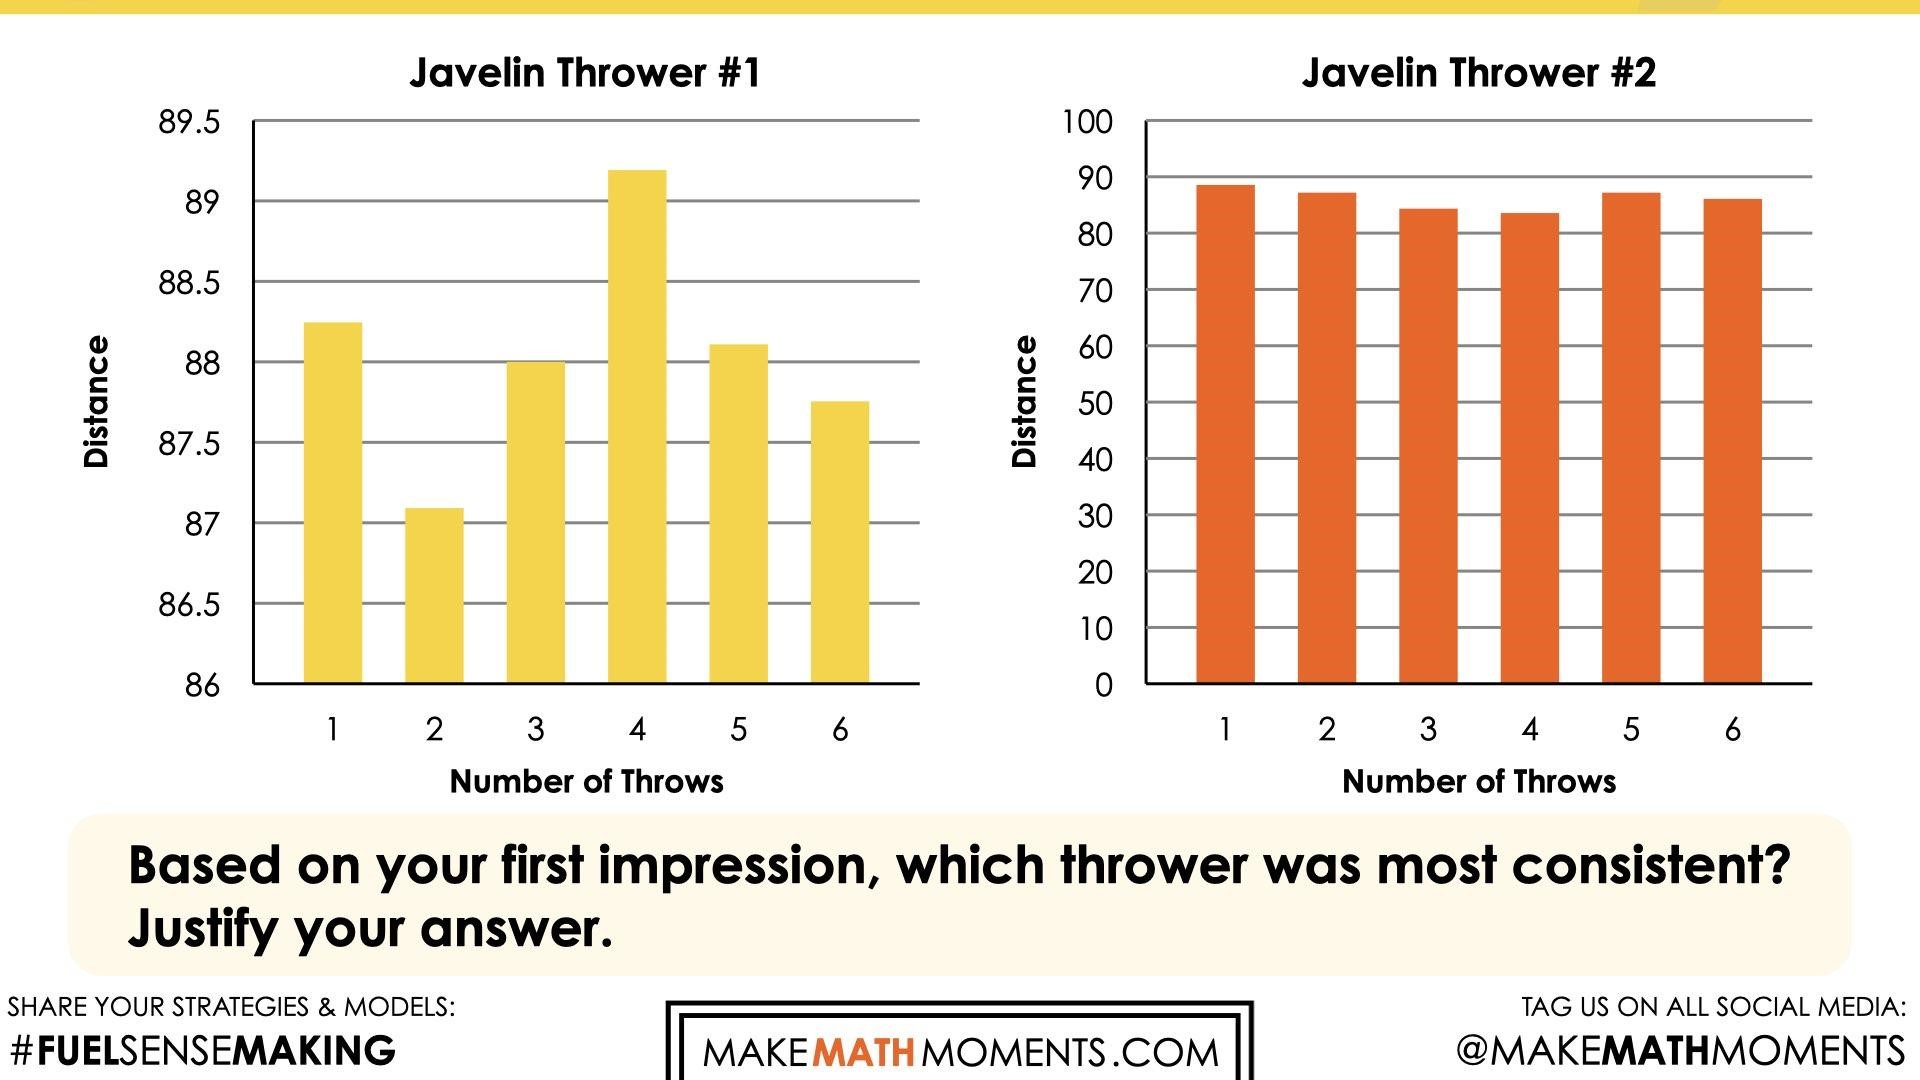
Consider the data sets below.
For each data set, determine the range. Identify the scale you would use to graph this data and justify your choice.
Consolidation Prompt #2
When using graphical representations to compare two or more data sets, why is it important to use the same scale?
Download Editable/Printable Handout
Become a member to access purposeful practice to display via your projector/TV, download the PDF to upload to your LMS and/or print for students to have a physical copy
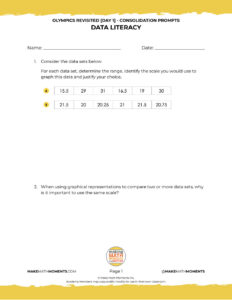
Download all files of Day 1


