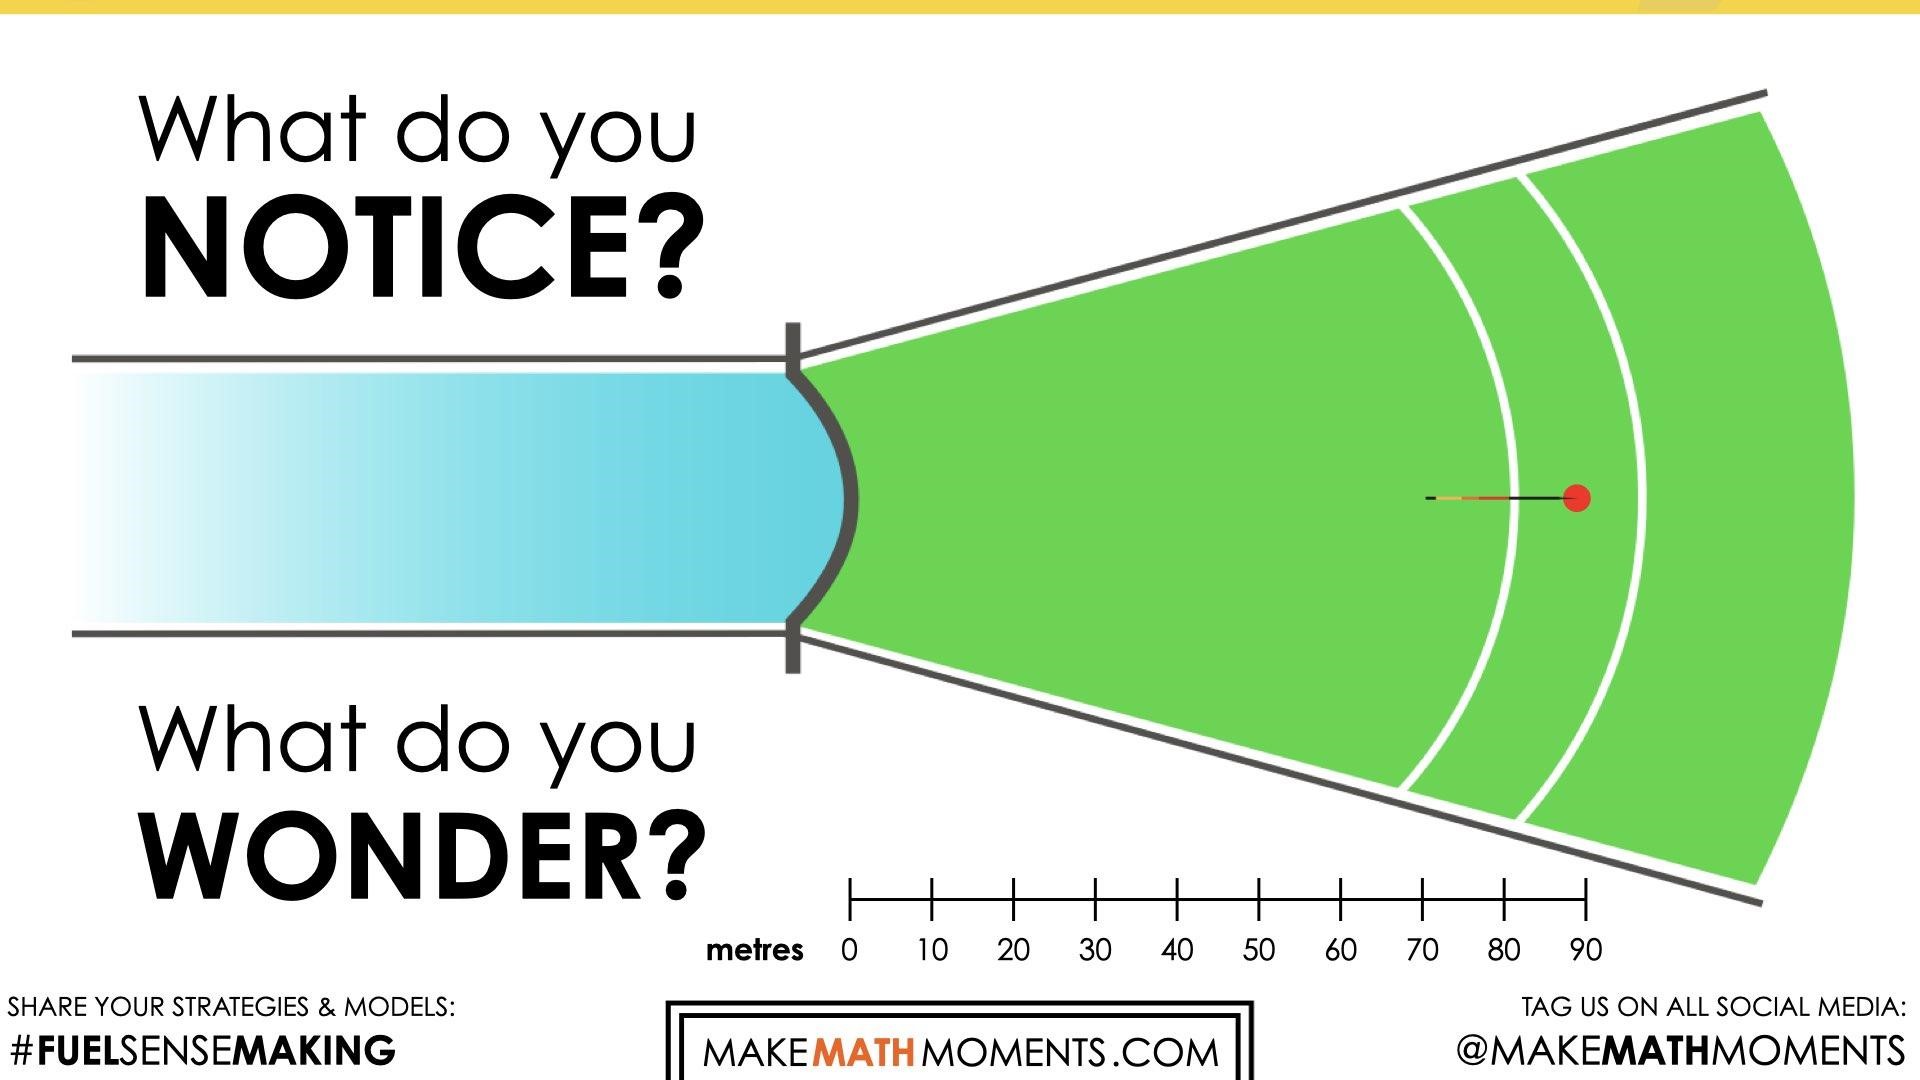
What Do You Notice? What Do You Wonder?
Show students this video:
Then, ask students:
What do you notice?
What do you wonder?
Give students 60 seconds (or more) to do a rapid write on a piece of paper.
Then, ask students to share with their neighbours for another 60 seconds.
Finally, allow students to share with the entire group.
Some of the noticing and wondering that came up in a class recently included:
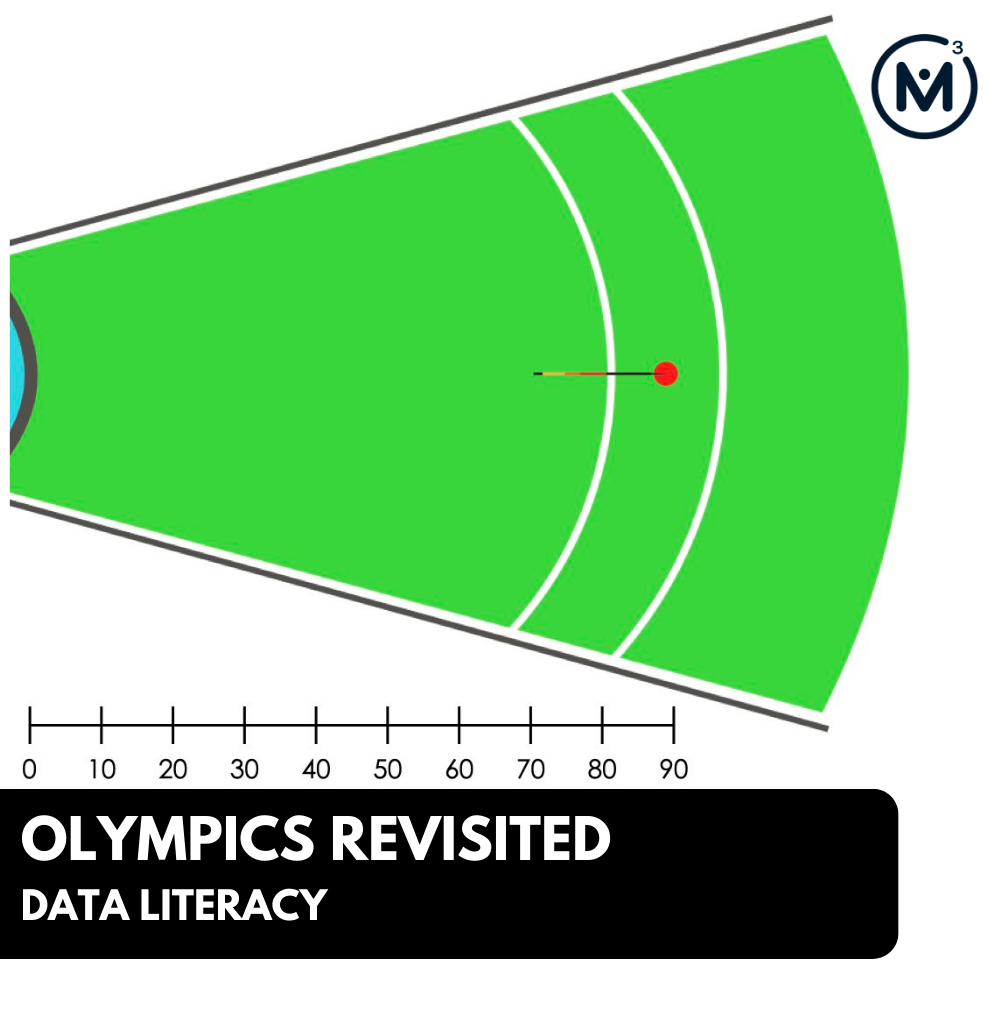
- I notice some type of field.
- I notice something being thrown and landing.
- I notice a scale below, it goes up by 10.
- I wonder if this is a sport.
- I wonder if the scale is in feet or metres.
- I wonder where it landed.
At this point, you can answer any notices and wonders that you can cross off the list right away. Share the following information:
This is an animation of a Javelin throw runway and landing sector. Javelin throw is part of the athletics (track-and-field) sport. It is a sport where athletes throw a spear called a javelin for distance. Each throw is measured from the throwing arc to the point of impact. The distance is measured in metres.
Estimate: Prompt
Student prompt:
How far was this javelin thrown?
Make an estimate.

We can now ask students to make an estimate (not a guess) as we want them to be as strategic as they can possibly be. This will force them to use reasoning to try and come up with a reasonable distance for this throw.
Consider asking students to think about a number that would be “too low” and a number that would be “too high” before asking for their best estimate in order to help them come up with a more reasonable estimate.
Let them chat with their neighbours and challenge them to an estimation duel or a math fight.
Also consider asking students:
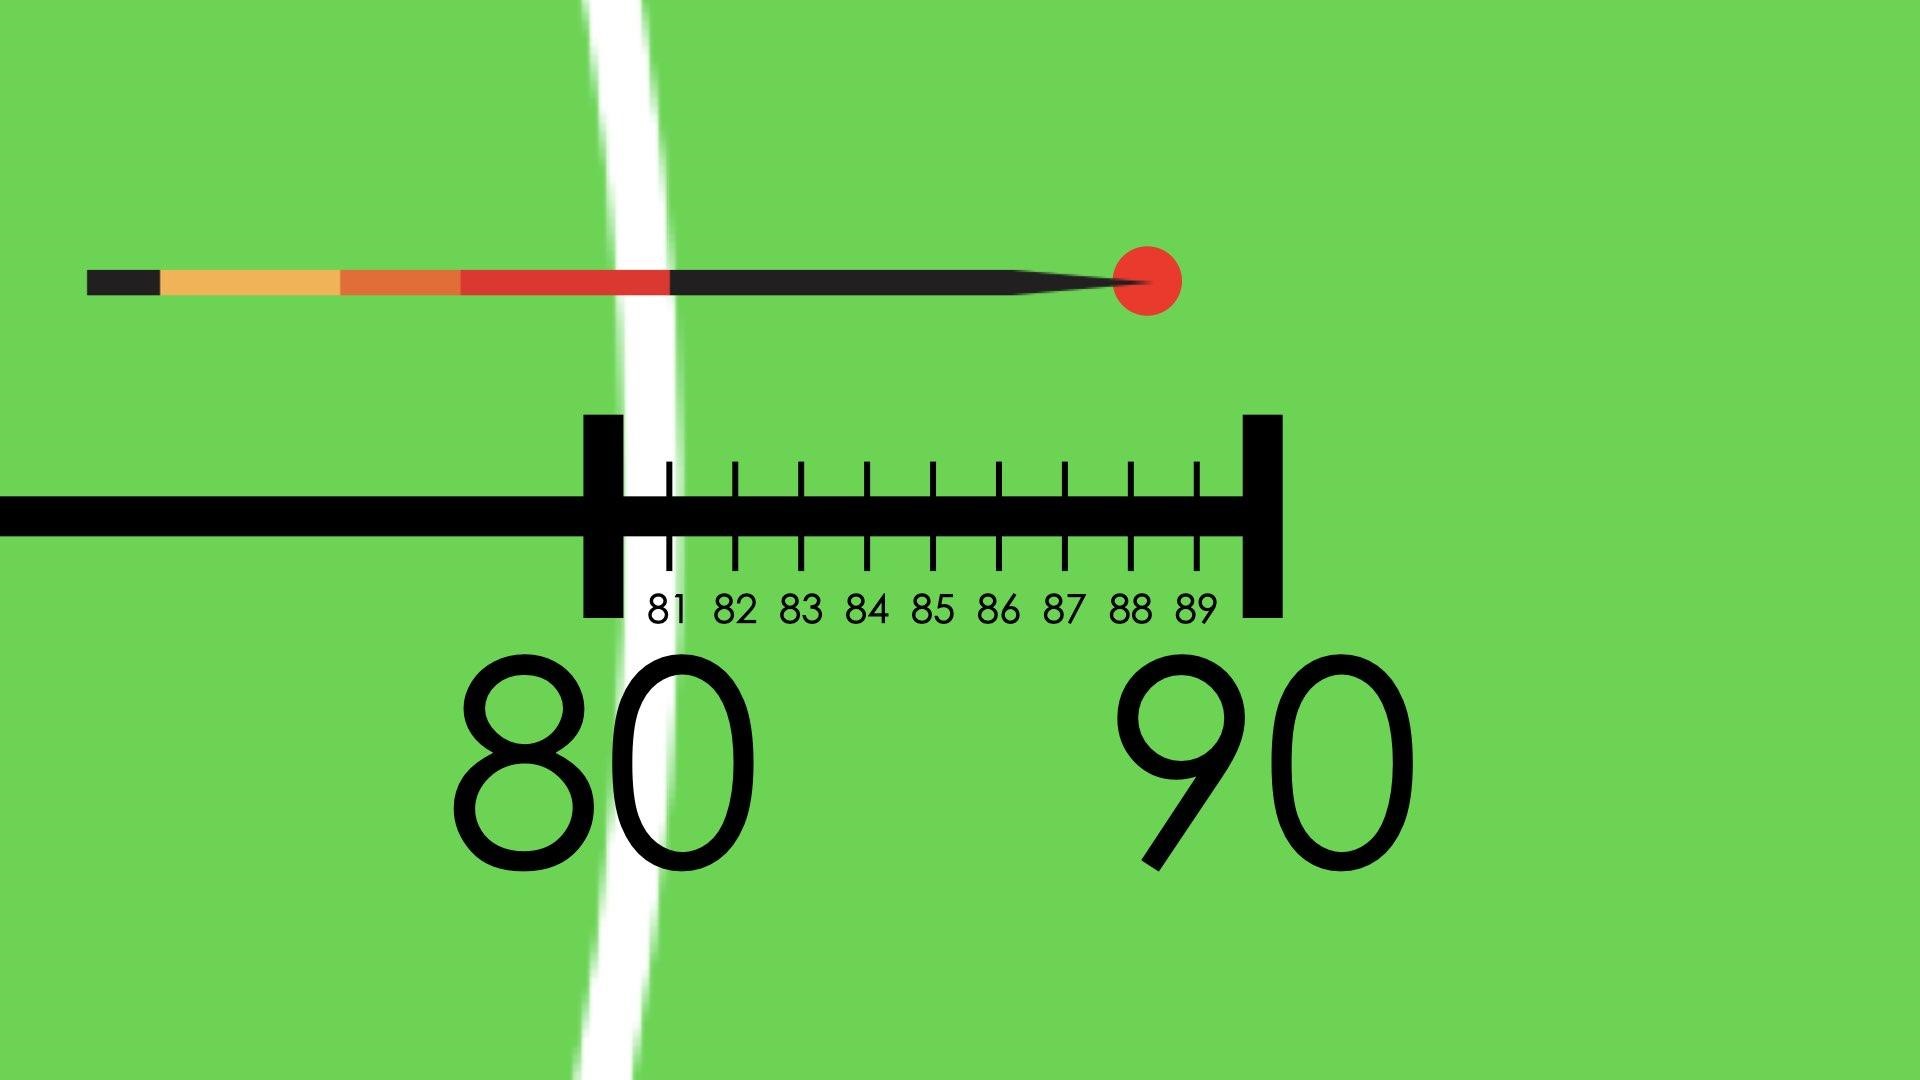
How might you make your estimate more precise?
Students might recommend moving the scale upwards or zooming in to get a better look.
Update Estimate: Prompt
Student prompt:
Update your estimate.
We can now ask students to update their estimate.
While Students Are Estimating…
Monitor student thinking by circulating around the room and listening to the mathematical discourse. Encourage students to use precise mathematical language and listen for the use of fractional language. Are students considering the relationship between the point of impact and the scale, noticing that the throw is less than halfway between 88 and 89 metres. How are students describing this distance? 88 and one-fourth of a meter? 88 metres and 25 centimetres? 88.25 metres?
Allow students to share their estimates with neighbours first, then with the class. Write down their estimates on the chalkboard/whiteboard/chart paper so students feel their voices are being heard and so they feel they have a stake in solving this problem.
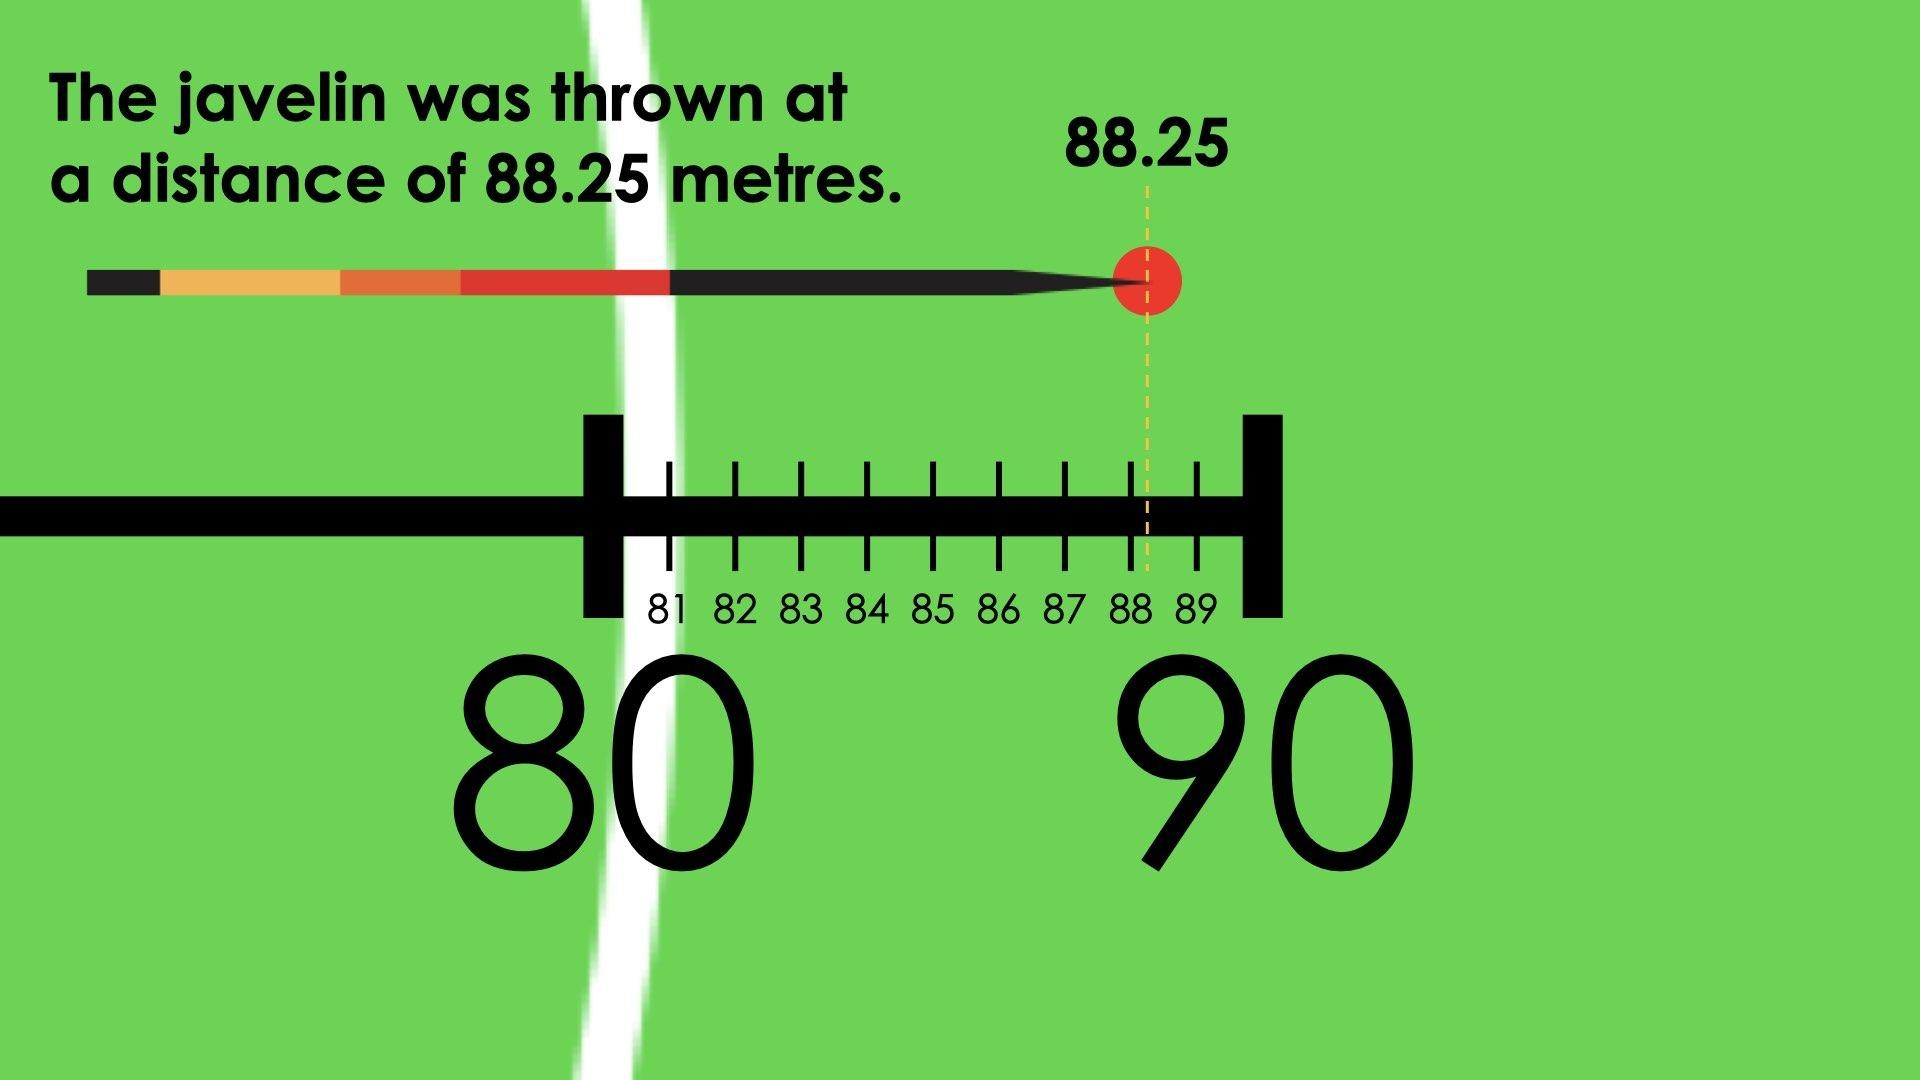
Estimation Reveal
Share the following image with students to reveal the actual distance of this throw.
Crafting A Productive Struggle: Prompt #1
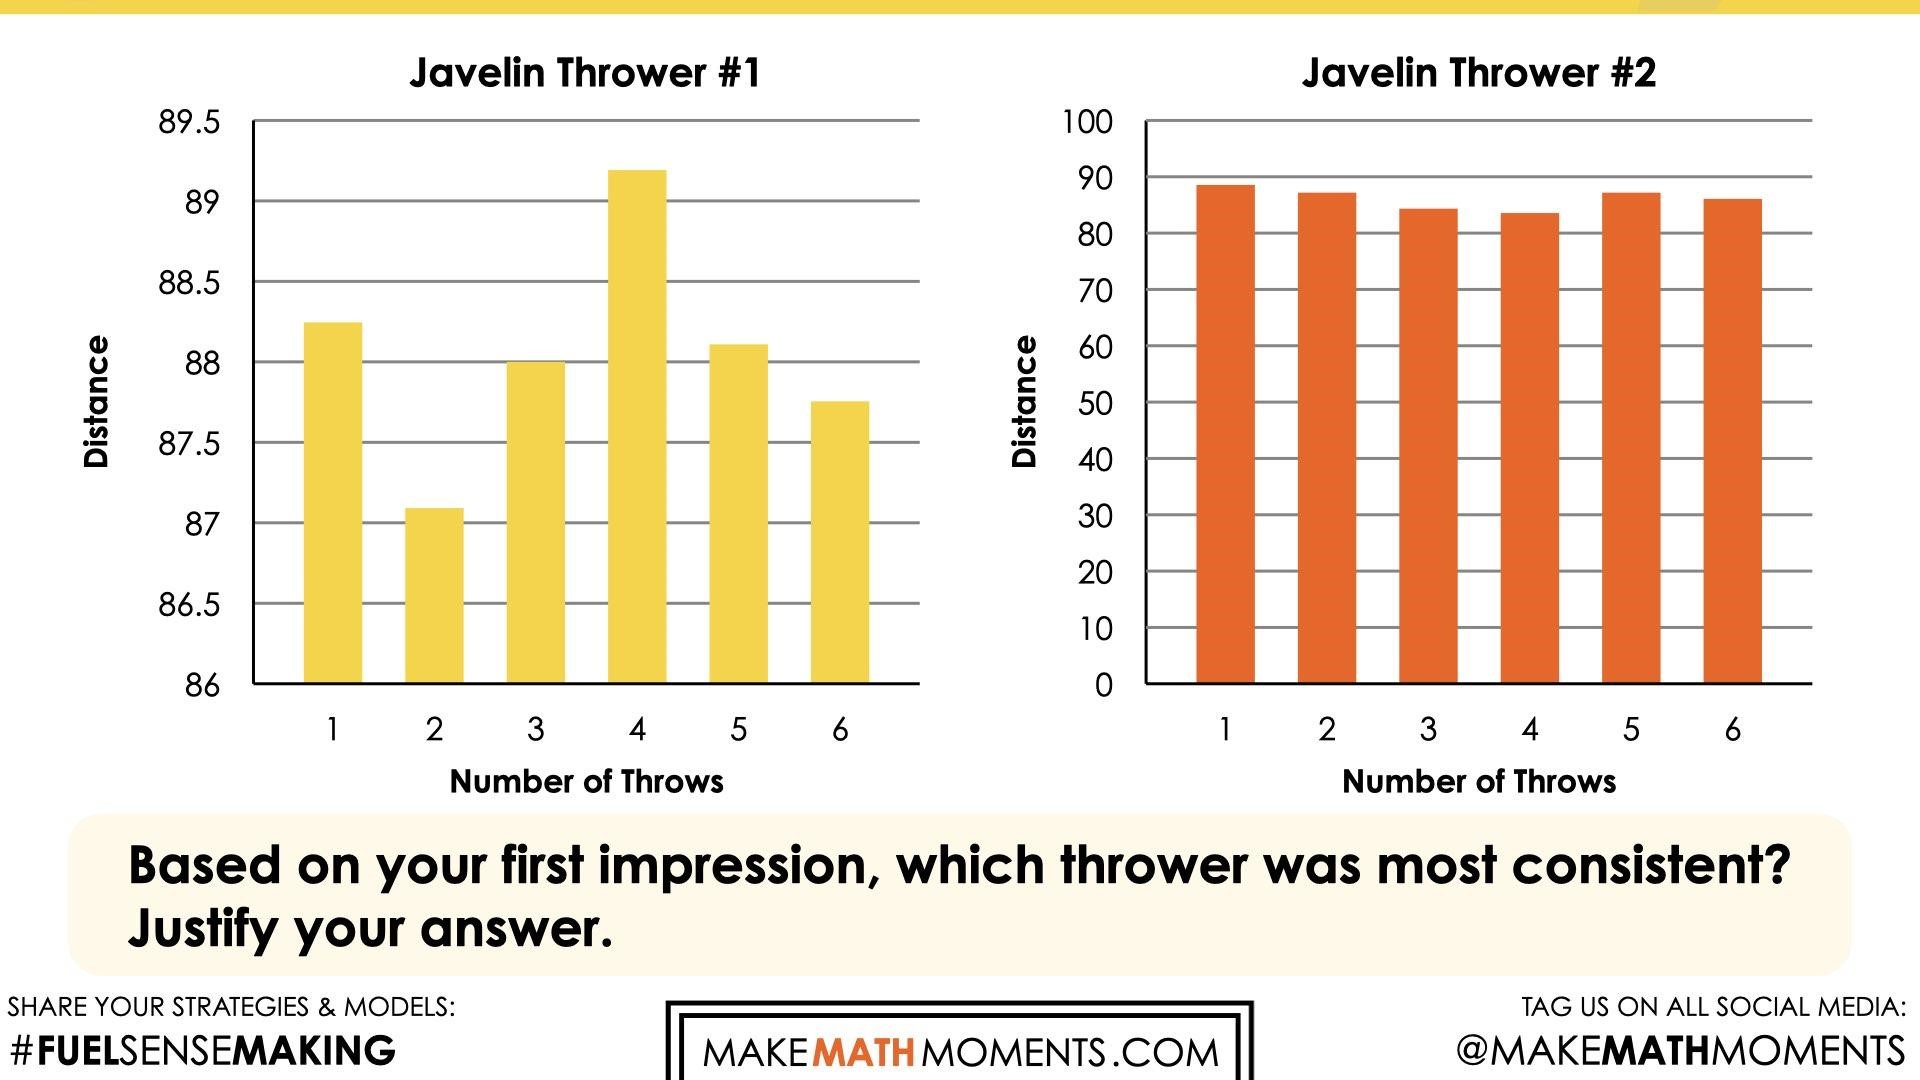
Share the following graphs with students.
Explain that the two value-bar graphs represent the six throws of two different male competitors in the javelin throw at the Olympic games.
Student prompt:
Based on your first impression, which thrower was most consistent? Justify your answer.
Allow students some time to discuss and share what they see.
Then, prompt students with:
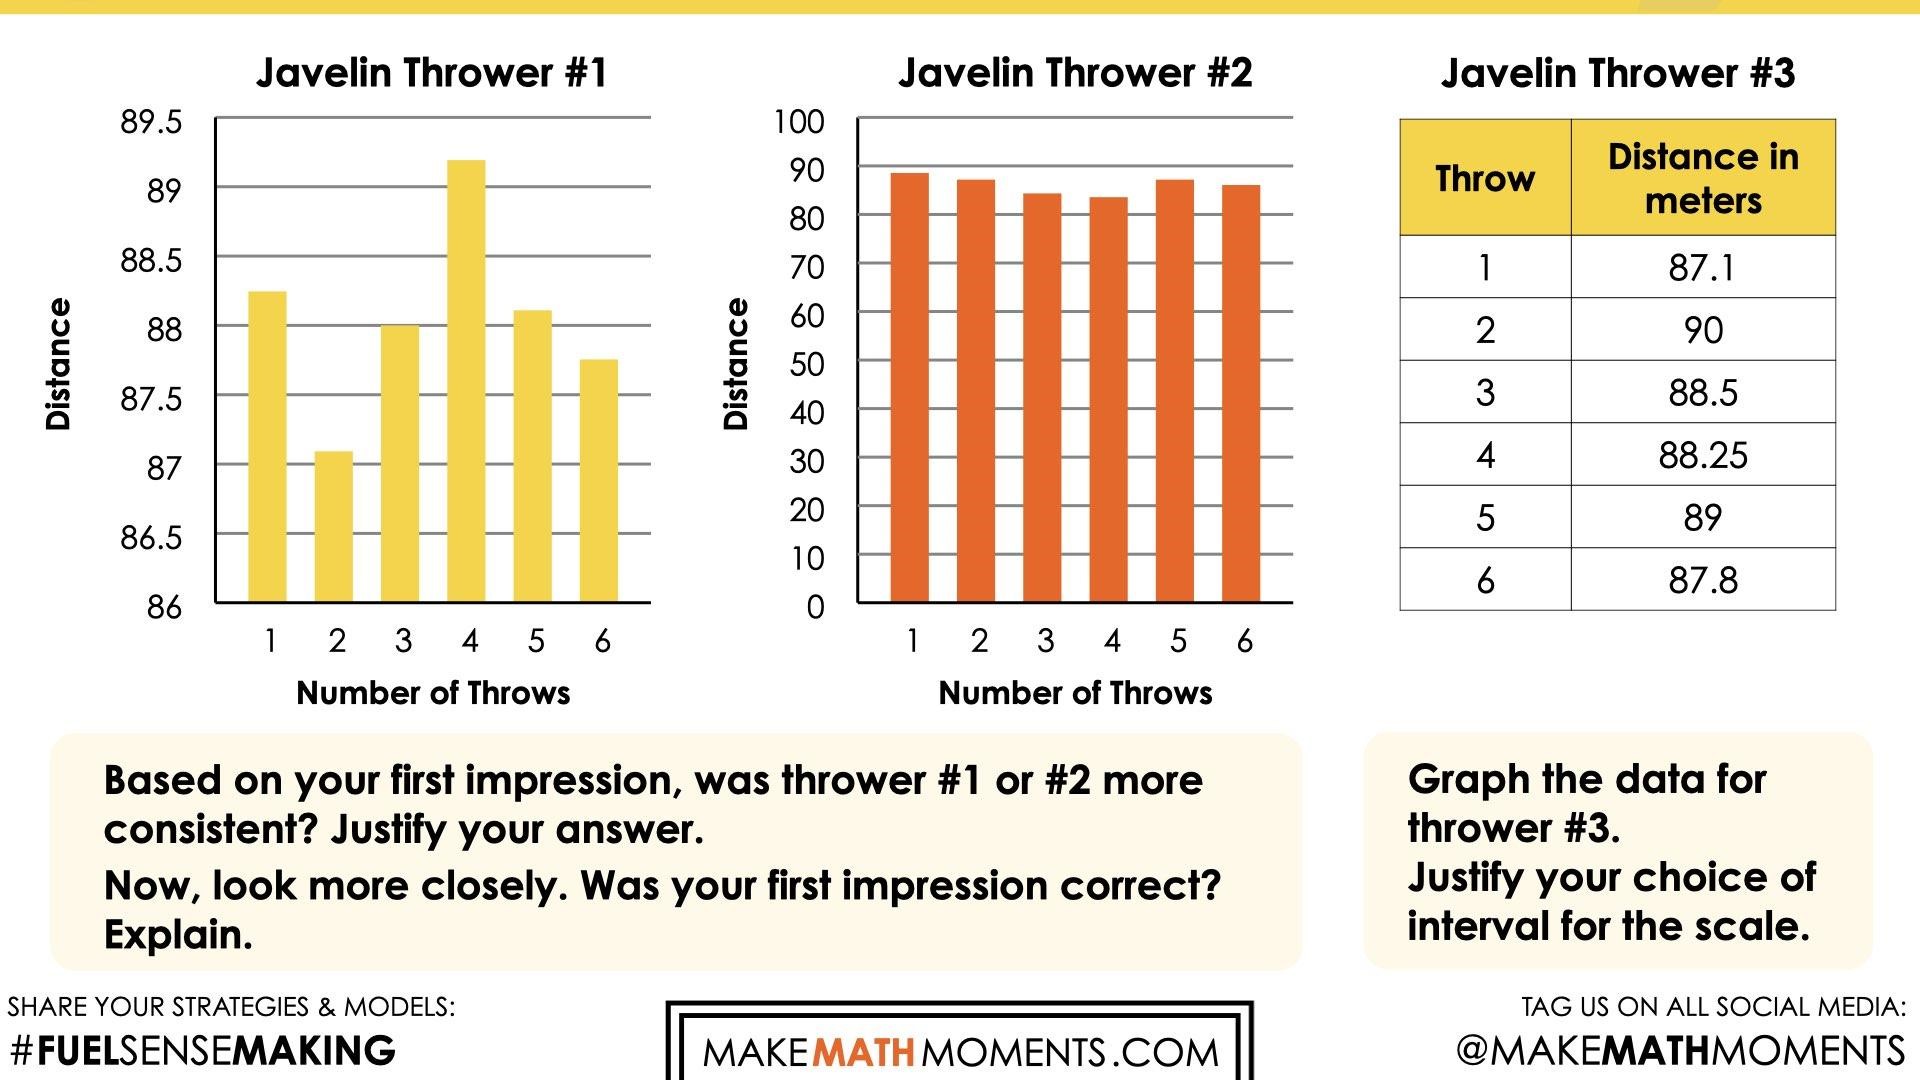
Now, look more closely. Was your first impression correct? Explain.
Crafting A Productive Struggle: Prompt #2
Student Prompt:
The data for a third thrower is shown in the table below.
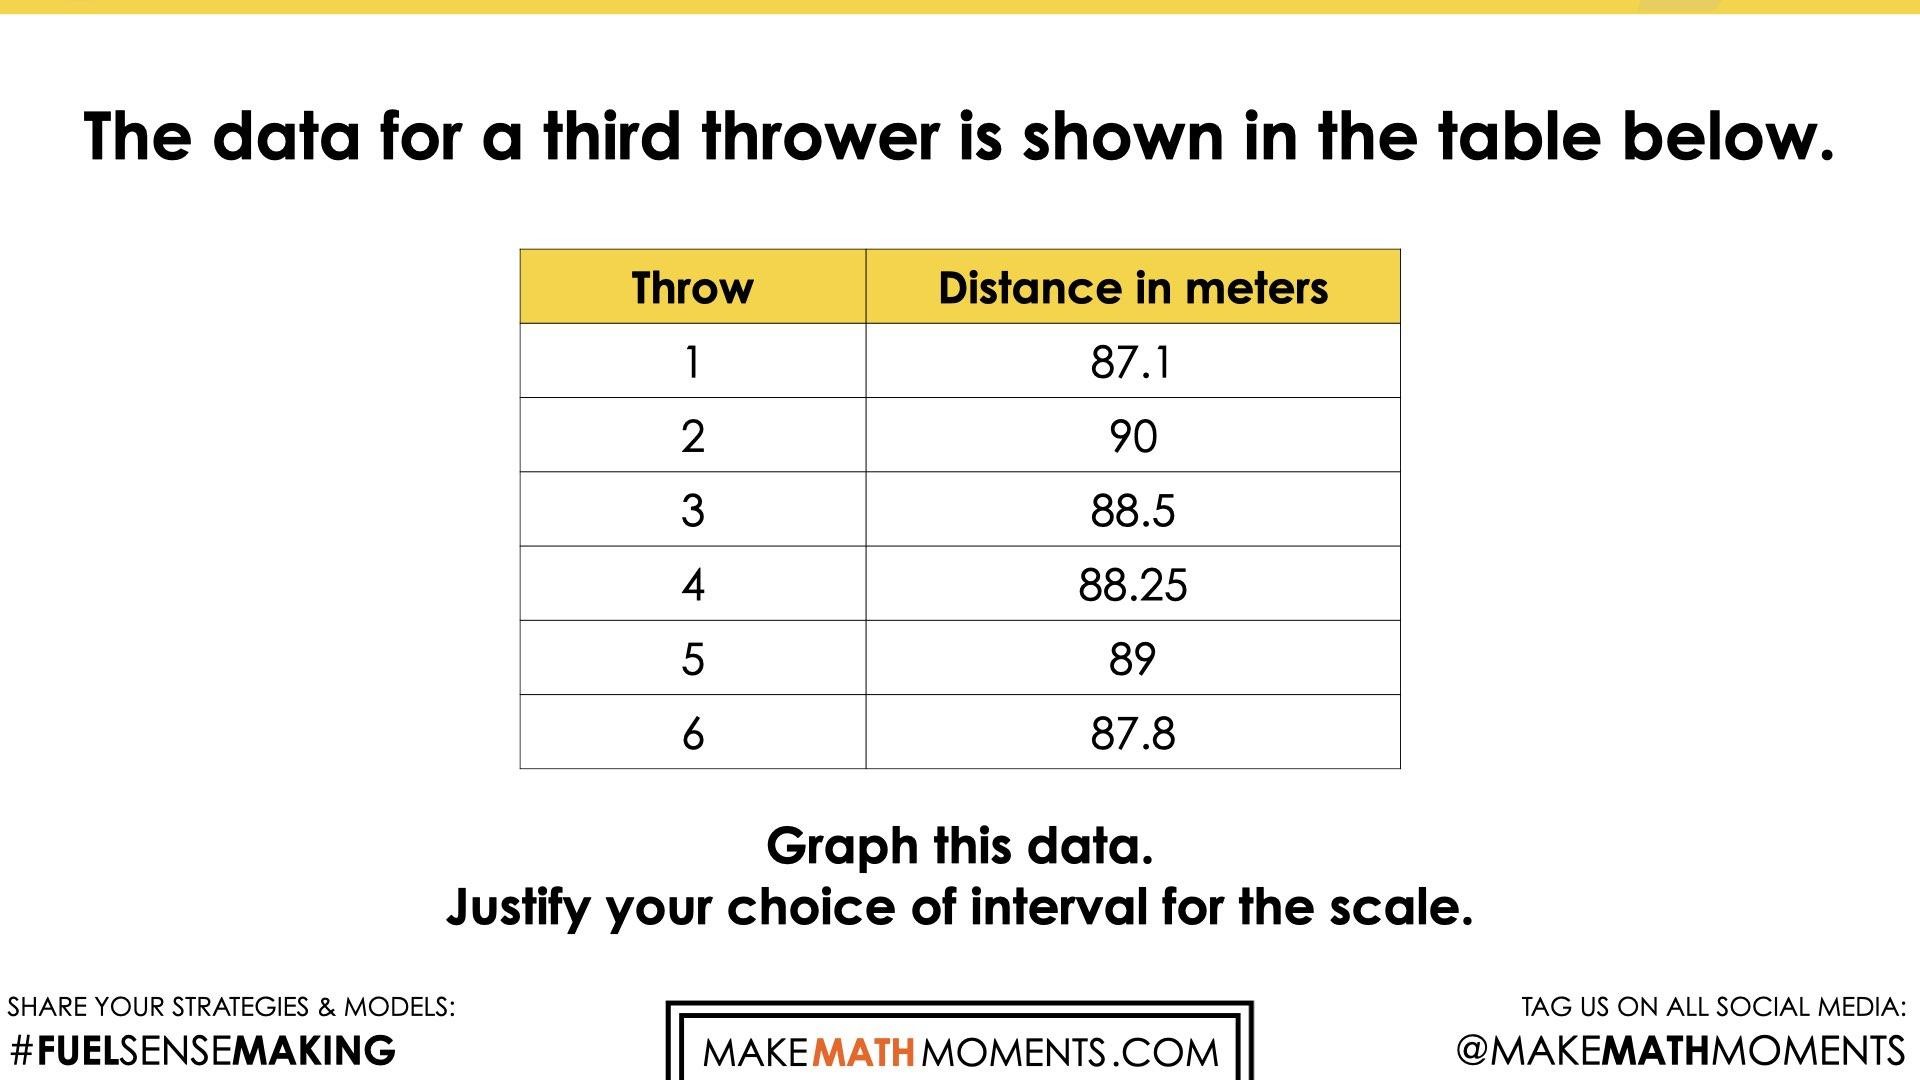
Graph this data.
Justify your choice of interval for the scale.
Sample Student Responses
1a. Based on your first impression, which thrower was most consistent? Justify your answer
Students will likely notice that the first graph shows greater variation between the bars, suggesting that the distance of each throw varied significantly and this thrower was less consistent. While in the second graphical representation, you could practically draw a line across the value bars. The graph does not show much variation.
1b. Was your first impression correct? Explain.
Upon closer examination, students might discover that this first notion is incorrect, the graphs are misleading. The first thrower had a range of 87 to 89, while the second thrower’s distances range from about 85 to 89. Students were misled because of the scale. For one, the second graph starts at 0, making the bars much longer and it appears that they are closer together. With an interval of 10, it is hard to see the variation. The first graph on the other hand zooms into the values between 86 and 89.5. This really allows us to see the variance, and with a scale of 0.5, we can be a lot more precise.
2a. Graph this data.
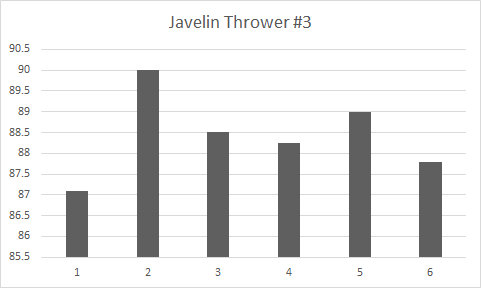
2b. Justify your choice of interval for the scale.
Students will likely select an interval of 1 or 0.5. Because all of the distances are so close together, the range is so small, it makes sense to highlight the small variance by zooming into the data. The smaller interval allows the reader to communicate the exact distance of each throw with more precision.
Reveal
Show students the following graphs for all three javelin throwers using the same scale.
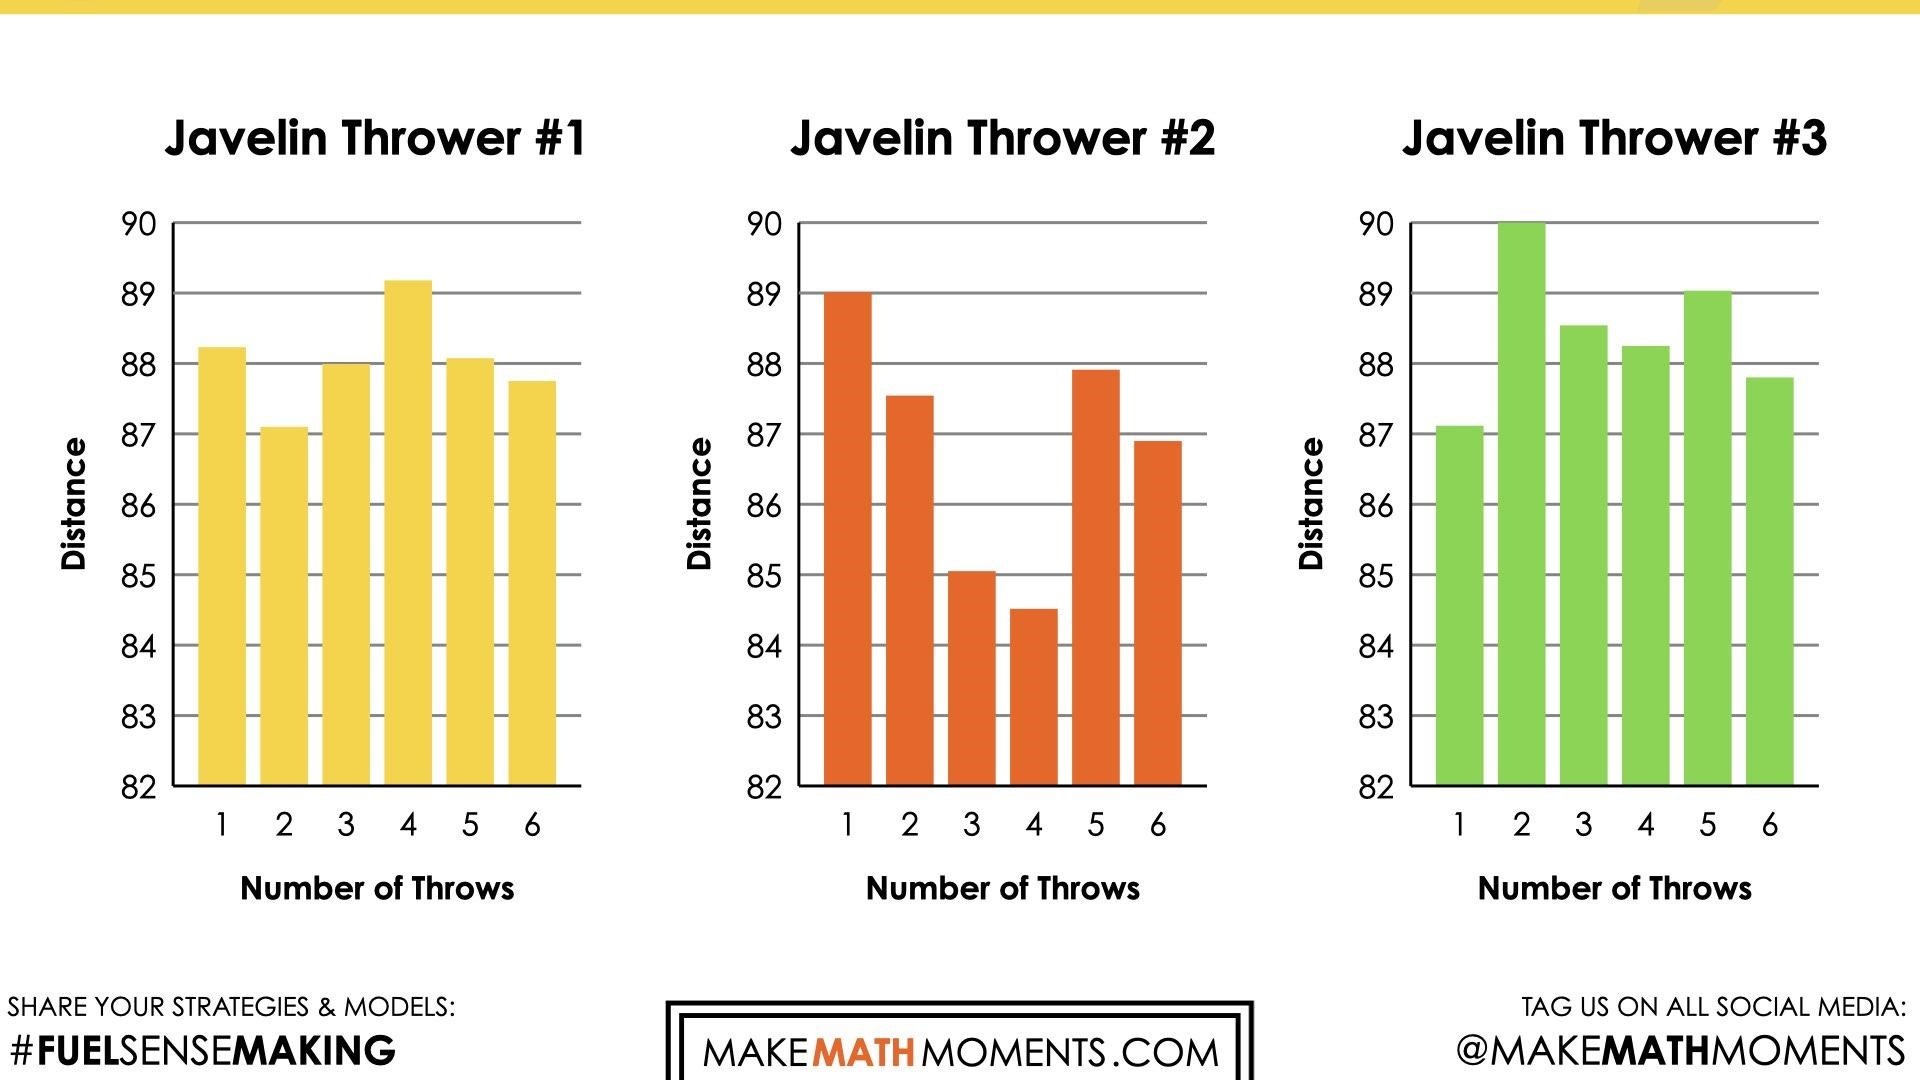
Focus today’s consolidation on the impact of the scale. Discuss how selecting the interval and whether or not to start the scale at 0 can have a significant impact on the audience’s reaction and initial notions of the results. For this reason, when we are using graphs to compare two or more data sets, it is important to use the same scale. Otherwise, the data may be misleading.
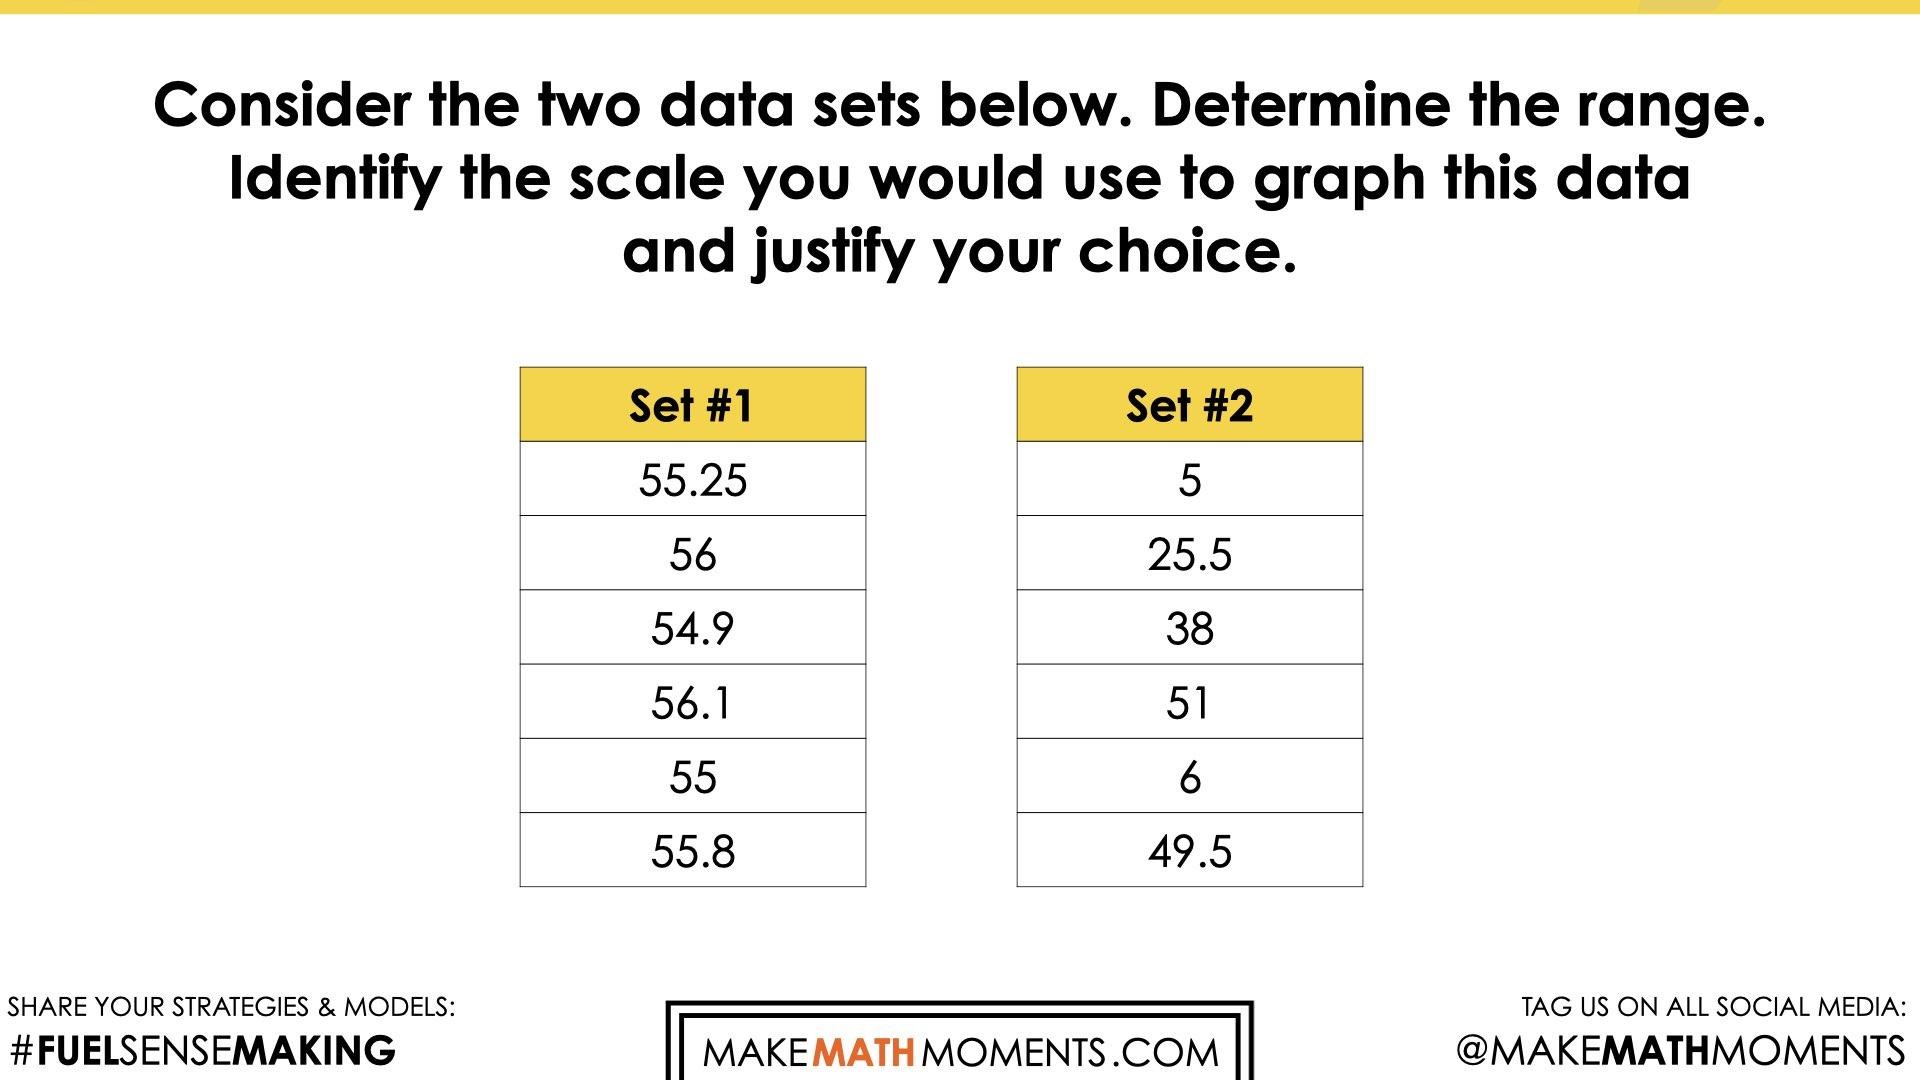
Oftentimes, the choice of interval and starting point is based on the range of the data. The range of a set of data is the difference between the highest and lowest values in the set
Student prompt:
Consider the two data sets below.
Determine the range.
Identify the scale you would use to graph this data and justify your choice.
Provide students an opportunity to reflect on their learning by offering these consolidation prompts to be completed independently.
Consolidation Prompt #1:
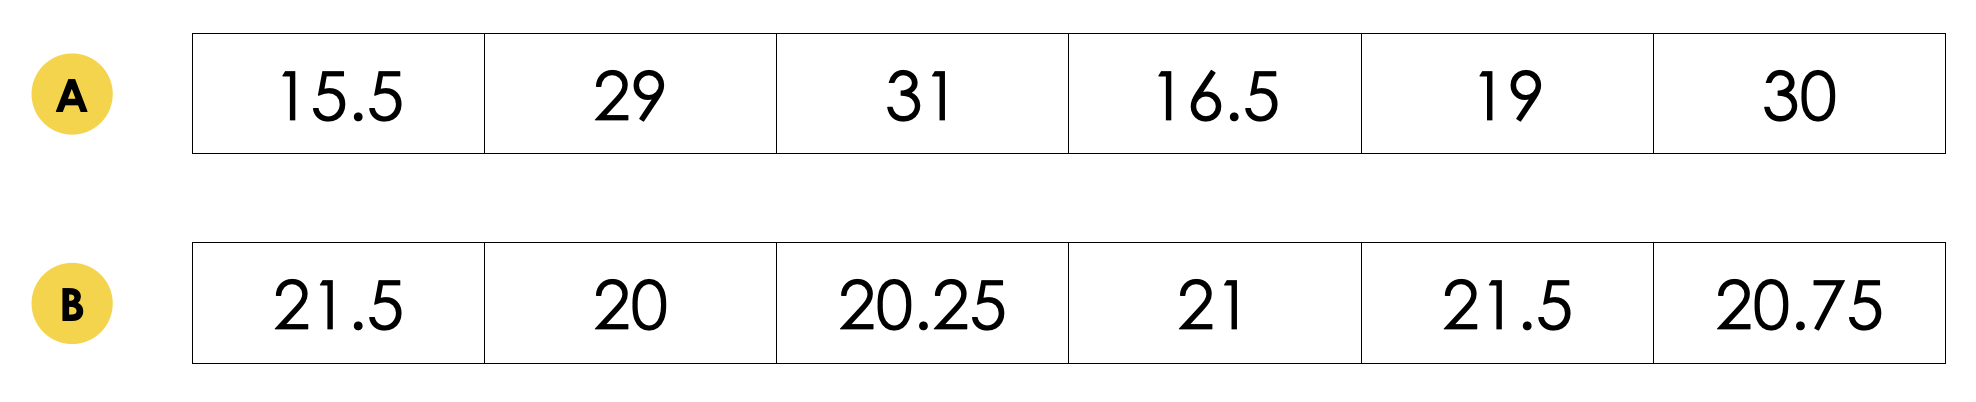
Consider the data sets below.
For each data set, determine the range. Identify the scale you would use to graph this data and justify your choice.
Consolidation Prompt #2:
When using graphical representations to compare two or more data sets, why is it important to use the same scale?
We suggest collecting this reflection as an additional opportunity to engage in the formative assessment process to inform next steps for individual students as well as how the whole class will proceed.