Task Teacher Guide
Be sure to read the teacher guide prior to running the task. When you’re ready to run the task, use the tabs at the top of the page to navigate through the lesson.
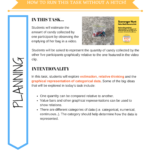
In This Task…
In today’s lesson, we will revisit the concept of mean as being the great equalizer. Students will also apply the big ideas introduced over the past three days through an independent task.
Intentionality…
The following big ideas will be reinforced in today’s lesson:
- There are different categories of data (i.e. categorical, numerical, continuous). The category should help determine how the data is represented.
- Value bars and other graphical representations can be used to show relations.
- There are different types of scales used in graphical representations and two different scale types can be used in a single graph (i.e. nominal and interval).
- A second axis can be used to show a precise quantity.
- Intervals on a scale can be unitized to represent larger quantities.
- Calculating the mean is a way to determine a single value to represent all of the quantities in a data set.
- Mean is re-balances all of the quantities within a data set to create equilibrium.
Math Talk
Prompts
Determine the mean for the following sets of data.
8, 6, 10, 8, 8
13, 15, 18, 14, 20
25, 33, 29, 20, 38
Encourage students to justify their answer by explaining the process supported by visual models or a context.
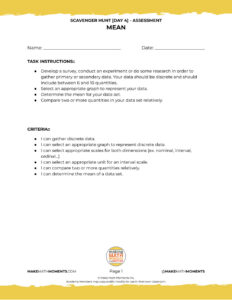
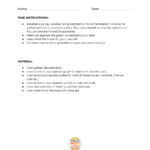
Assessment: Prompt
Login/Join to access the entire Teacher Guide, downloadable slide decks and printable handouts for this lesson and all problem based units.
Download Editable/Printable Handout
Become a member to access purposeful practice to display via your projector/TV, download the PDF to upload to your LMS and/or print for students to have a physical copy
JOIN TO DOWNLOAD
Resources and Downloads
Download a printable lesson plan, video/images, and presentation slides in Keynote and PowerPoint format to make the experience as smooth as possible here.
Lesson Tip Sheet
Download the lesson plan in PDF format so you can keep it handy and share with colleagues.
JOIN TO DOWNLOAD
Printable Handout
Download/edit the handout so you can keep it handy and share with colleagues.
JOIN TO DOWNLOAD
Explore The Entire Unit of Study
This Make Math Moments Task was designed to spark curiosity for a multi-day unit of study with built in purposeful practice, and extensions to elicit and emerge mathematical models and strategies.
Click the links at the top of this task to head to the other related lessons created for this unit of study.
Task Instructions
Login/Join to access the entire Teacher Guide, downloadable slide decks and printable handouts for this lesson and all problem based units.
Criteria
Login/Join to access the entire Teacher Guide, downloadable slide decks and printable handouts for this lesson and all problem based units.
Download Editable/Printable Handout
Become a member to access purposeful practice to display via your projector/TV, download the PDF to upload to your LMS and/or print for students to have a physical copy
JOIN TO DOWNLOAD