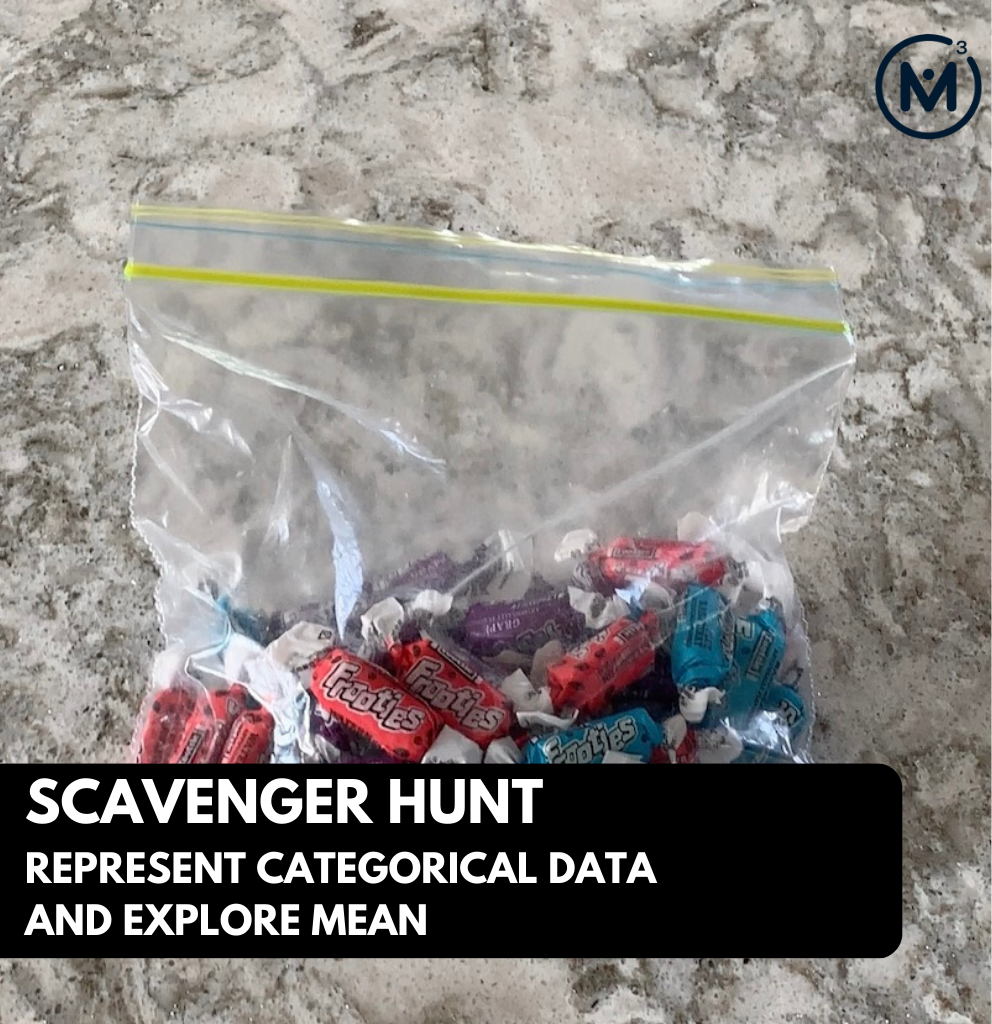
What Do You Notice? What Do You Wonder?
Show students this video: You may want to pause the video or keep the following image up on the screen: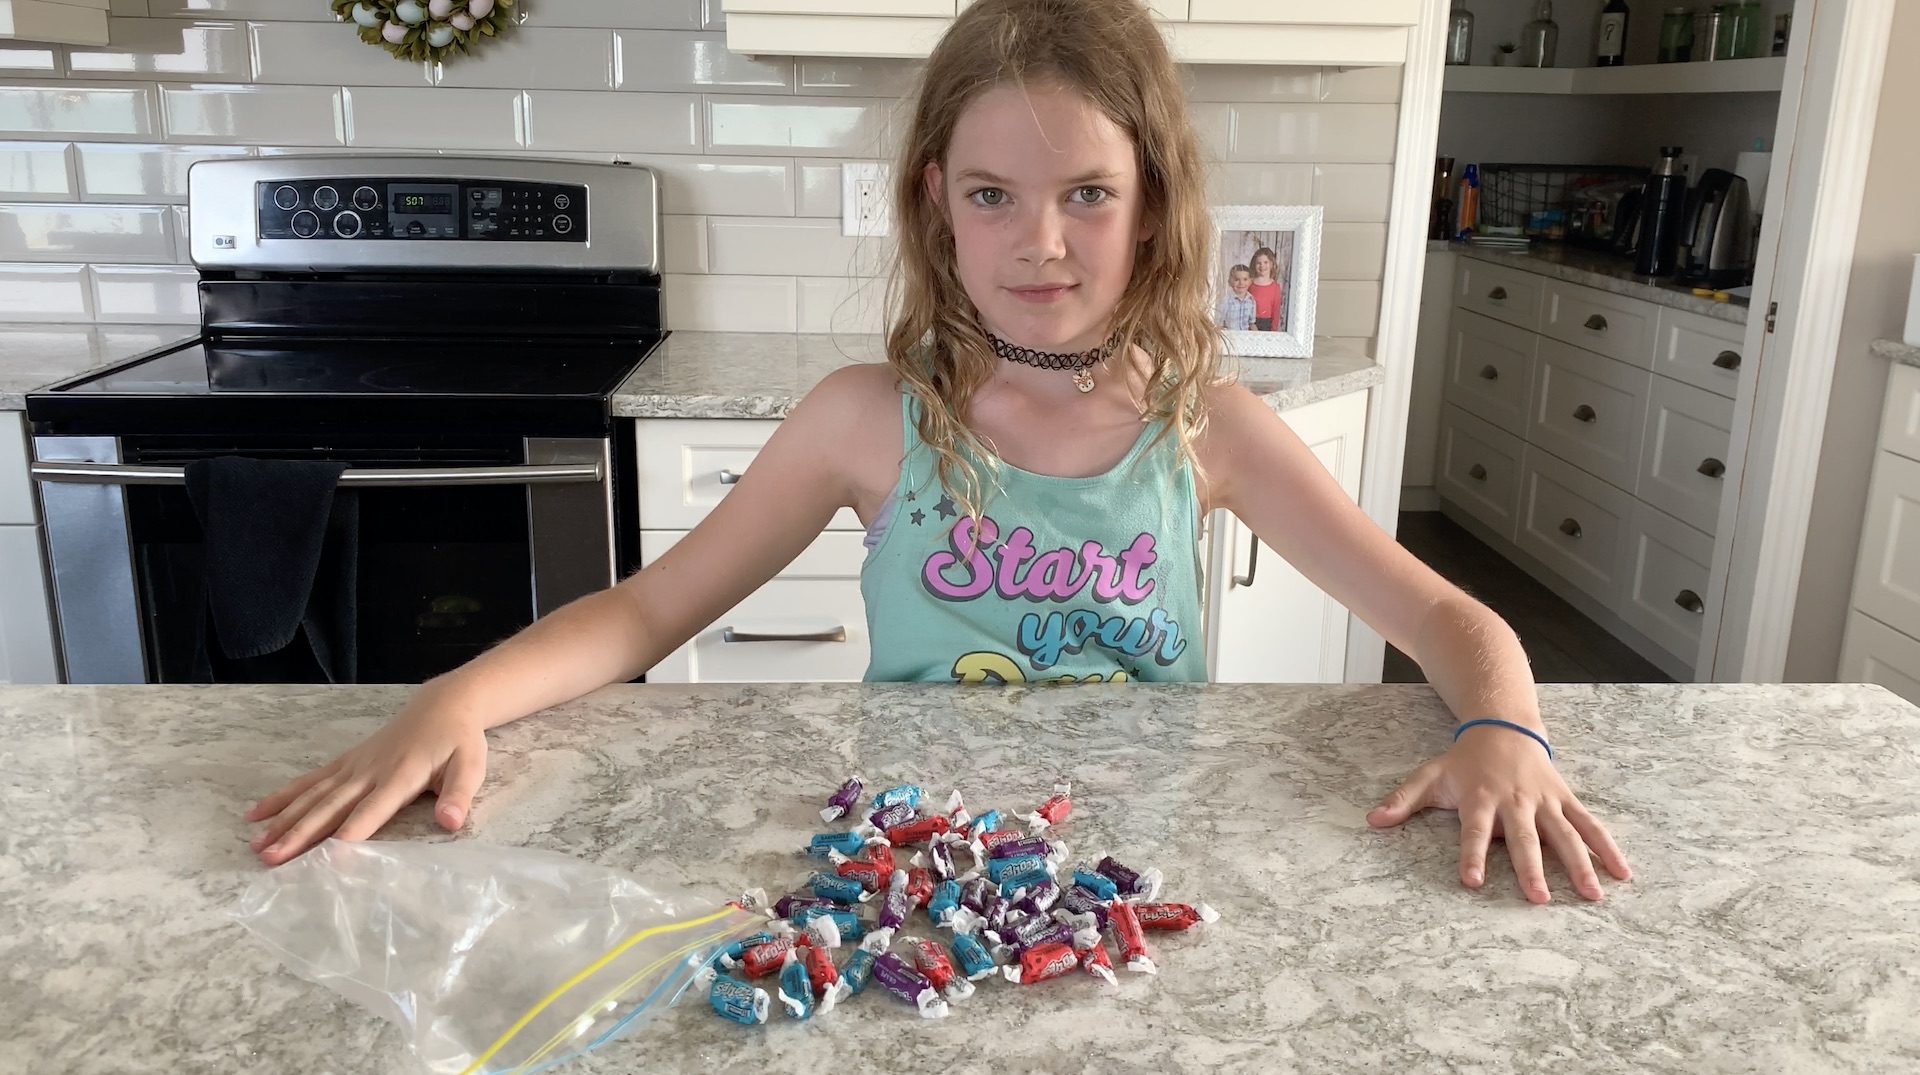 In this context, a girl is dumping out candy from a bag.
Then, ask students:
In this context, a girl is dumping out candy from a bag.
Then, ask students:
What do you notice? What do you wonder?Give students 60 seconds (or more) to do a rapid write on a piece of paper. Then, ask students to share with their neighbours for another 60 seconds. Finally, allow students to share with the entire group. Some of the noticing and wondering that came up in a class recently included:
- There is a girl with candy.
- She is dumping candy on the counter.
- She is in the picture with a boy in the background.
- Clean kitchen.
- I wonder what kind of candy that is?
- I wonder how many candies there are?
- Why is she dumping all of the candy on the counter?
- What is her name?
- How old is she?
- As well as others…
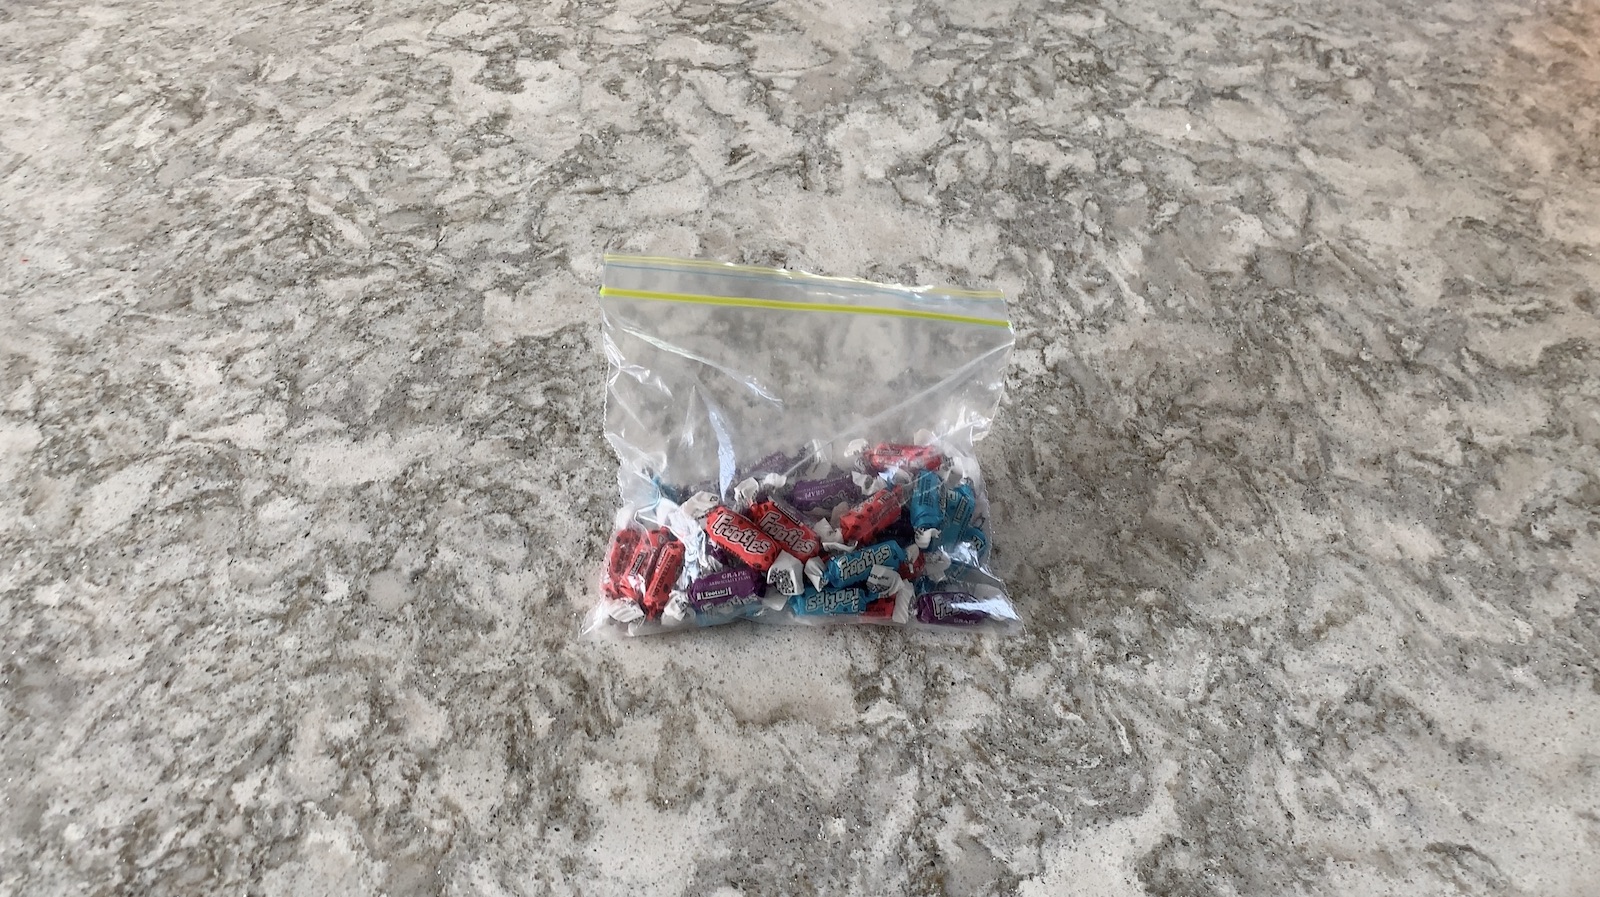
Estimation: Prompt
After we have heard students and demonstrated that we value their voice, we can land on the first question we will challenge them with:Follow up that question with:How many candies were in the bag?
We can now ask students to make an estimate (not a guess) as we want them to be as strategic as they can possibly be. This will force them to use spatial reasoning alone to try and come up with an initial estimate and to share it with their neighbours by trying to articulate why they believe their prediction is reasonable.How might we convince someone that the quantity you come up with is correct?
 Consider asking students to think about a number that would be “too low” and a number that would be “too high” before asking for their best estimate in order to help them come up with a more reasonable estimate.
Let them chat with their neighbours and challenge them to an estimation duel or a math fight.
Consider asking students to think about a number that would be “too low” and a number that would be “too high” before asking for their best estimate in order to help them come up with a more reasonable estimate.
Let them chat with their neighbours and challenge them to an estimation duel or a math fight.
While Students Are Estimating…
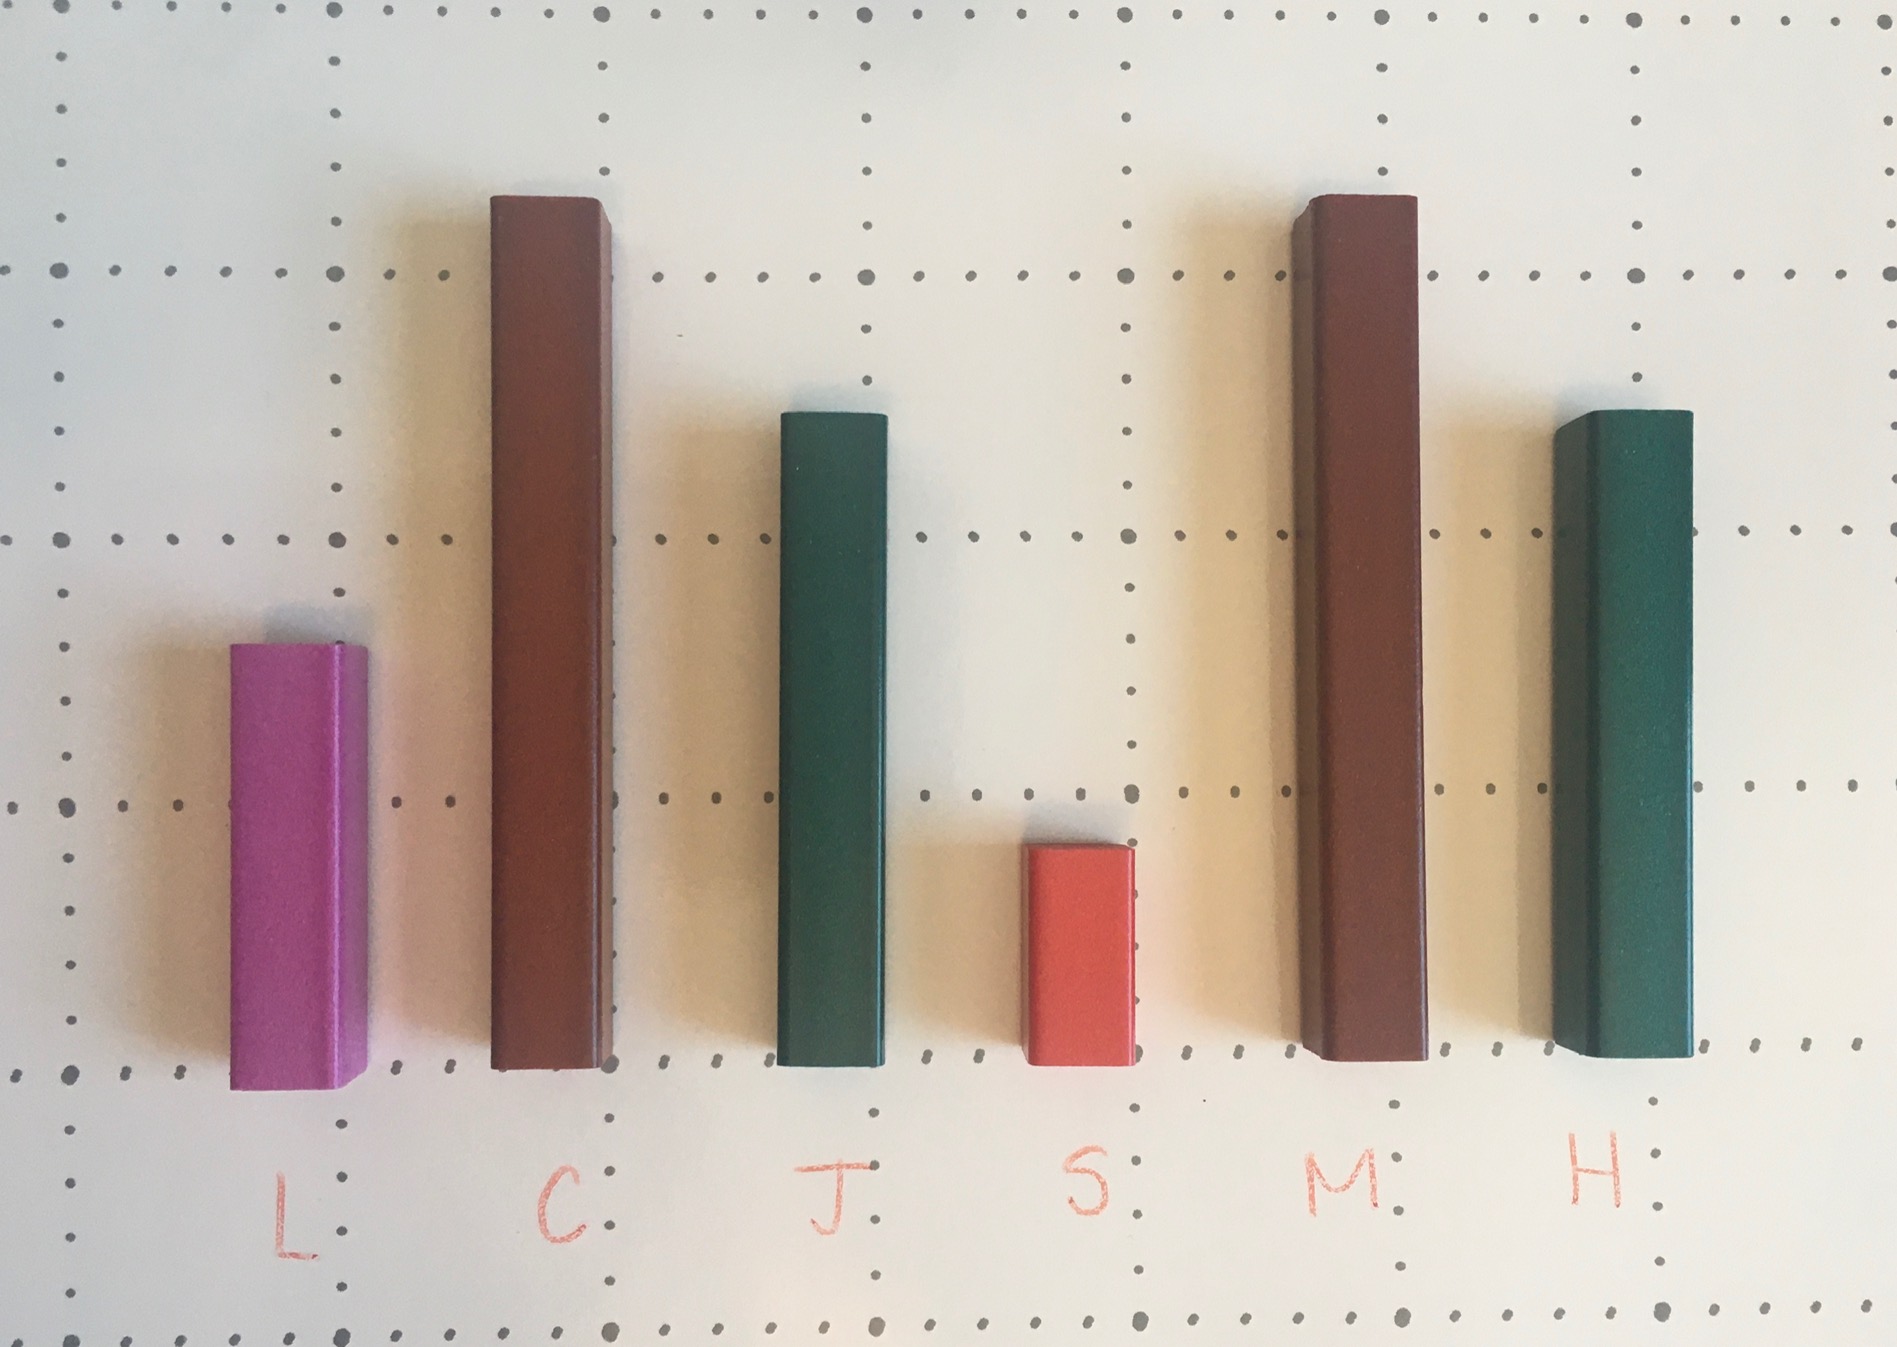
Monitor student thinking by circulating around the room and listening to the mathematical discourse. Encourage students to use precise mathematical language (including greater than, less than, more, less, half, rows…) and positional language (in front, behind, on top…) to articulate their defense. If students’ estimates are unreasonable, encourage them to select a manipulative similar in size of the candy (perhaps a linking cube) and ask them to lay out that number of items in front of them to consider whether that quantity seems reasonable. Allowing students to share their estimates with neighbours first, then with the class. Write down their estimates on the chalkboard/whiteboard/chart paper so students feel their voices are being heard and so they feel they have a stake in solving this problem. Tell students that you will not be sharing the exact quantity just yet, however, the number that they estimated will be useful.Student Approach #1: Concrete With Relational Rods
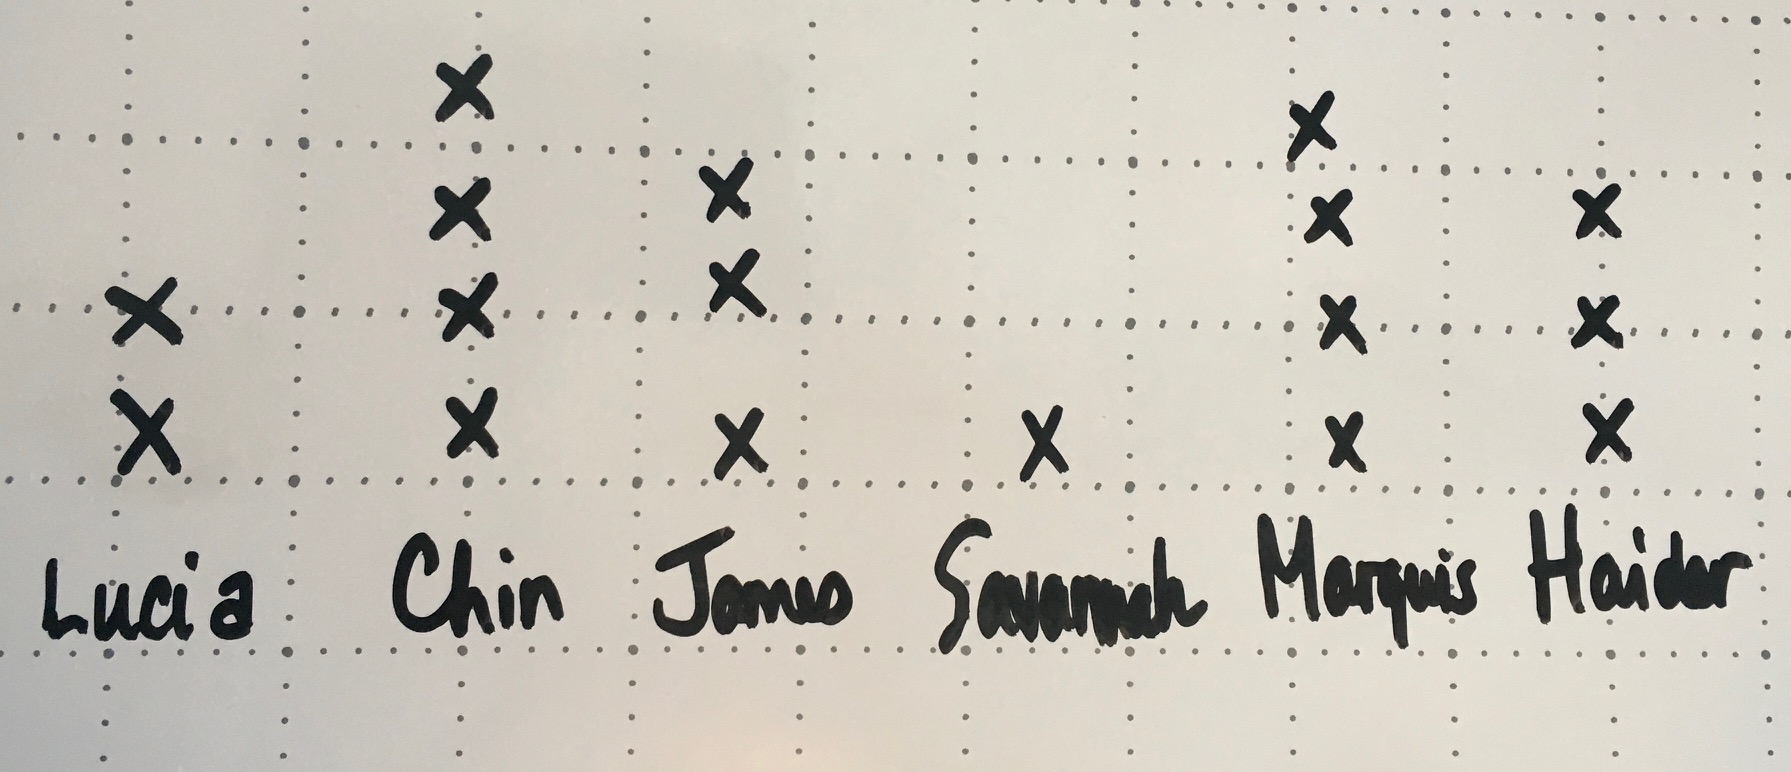
Student Approach #2: Graphing With a Line Plot
Student Approach #3: Bar Graph on Grid Paper
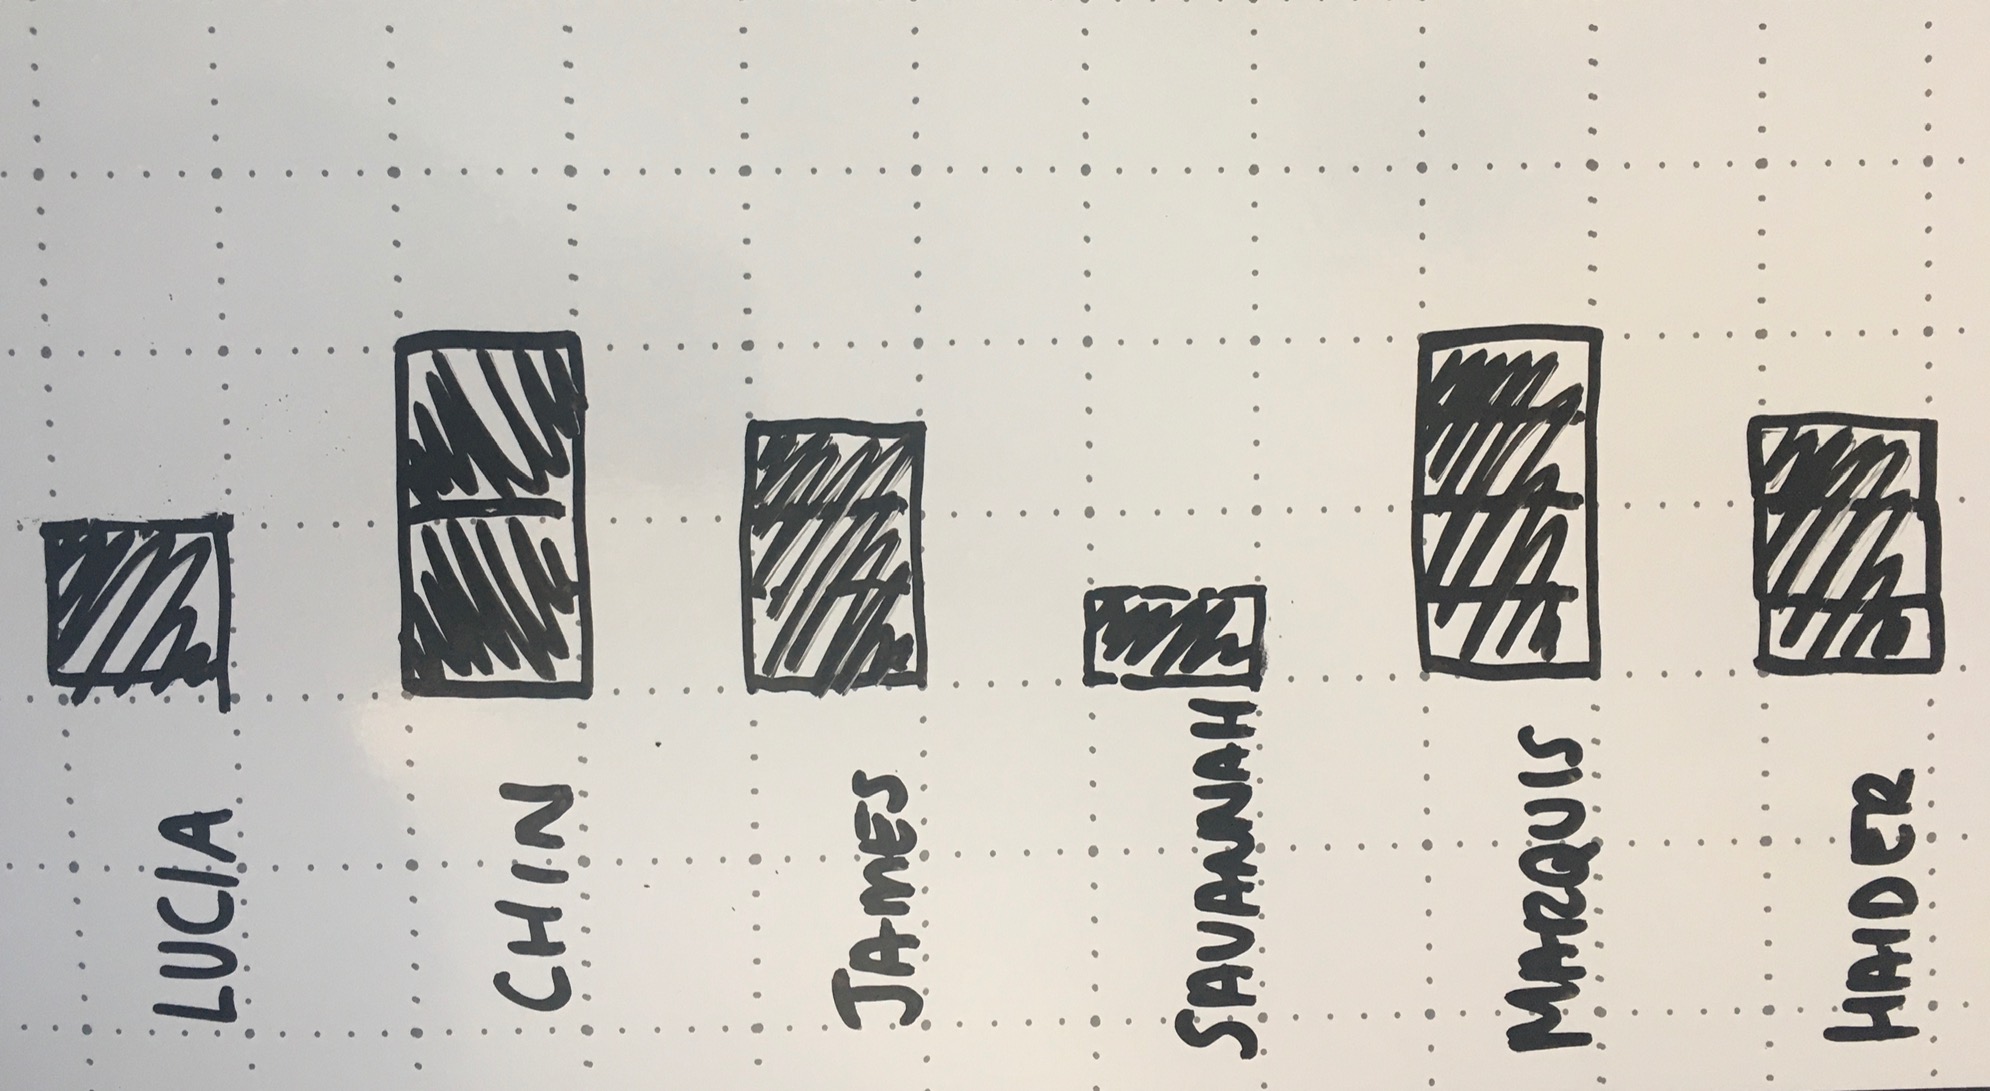
During the consolidation, you might consider exploring the relative quantities of candy based on the descriptors and their corresponding graphical representation. Some students might need a concrete tool such as square tiles to make sense of some of the more complex comparisons (i.e. 1 and 1/3 as great). The conversation should also highlight that this data is categorical and discrete and should therefore be represented using an appropriate graph (i.e. spaces between the bars) and a nominal scale on the x-axis.
You might consider using the following visuals to help guide the consolidation, or to help plan what models you might draw during the consolidation.