RISING WATER
INTRODUCING INTEGERS THROUGH LINEAR PATTERNING
In this unit, students will explore linear patterns with a negative initial value and negative rates as they analyze data based on rising water levels.
Intentionality
Spark Curiosity
Fuel Sensemaking
During Moves
Student Approaches
Next Moves
Consolidation
Reflect and Consolidation Prompts
Resources & Downloads
Educator Discussion Area
Intentionality & Unit Overview

Length of Unit: 6 Days
Access each lesson from this unit using the navigation links below
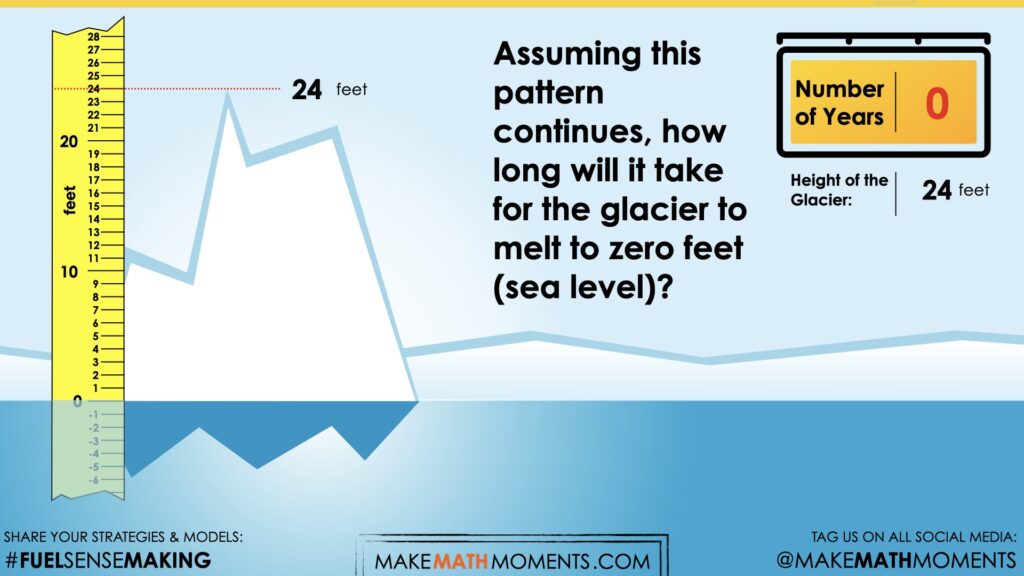
Students will analyze the pattern of a melting glacier.
Intentionality…
In this task, students will analyze and make predictions about a melting glacier over time. They will determine the initial value and the rate for the pattern. They will extend the pattern, describe the pattern rule in words, and make predictions. Some of the big ideas that may emerge in this unit include:
- Patterns can be extended because they are repetitive by nature.
- Pattern rules are generalizations about a pattern, and they can be described in words.
- One common use of linear patterns is predicting future events.
- A pattern can be extended to make a prediction.
- For far predictions, calculations are required for efficiency.
- In a growing pattern, the values increase and the rate is positive.
- In a shrinking pattern, the values decrease and the rate is negative.
- In a linear pattern, the values increase at the same rate.
- The rate can be determined by finding the difference between the value of two terms through subtraction.
- The order in which integers are written in a subtraction statement matters because the commutative property does not hold true.
- Constant difference refers to the idea that the difference between two numbers does not change after adding or subtracting the same quantity to both numbers.
- The initial value in a linear pattern is the constant.
- When the initial value is not zero, the relationship between the two variables is not proportional.
- Graphical representations of linear growing patterns appear as straight lines.
- The initial value in a linear pattern is the constant.
- When the initial value is not zero, the relationship between the two variables is not proportional.
Spark Curiosity
What Do You Notice? What Do You Wonder?
Show students this video:
What do you notice?
What do you wonder?
Give students 60 seconds (or more) to do a rapid write on a piece of paper.
Consider replaying the video here, but prompting students with the following:
I’m going to play the video again.
What will you be looking for when I do?
Then, ask students to share with their neighbours for another 60 seconds.
Finally, allow students to share with the entire group. Be sure to write down these noticings and wonderings on the blackboard/whiteboard, chart paper, or some other means to ensure students know that their voice is acknowledged and appreciated.
Some of the noticing and wondering that may come up includes:
- I notice water.
- I notice a glacier.
- I notice a scale.
- I notice the glacier melting.
- I notice a the number of years across the screen.
- I notice it started at 0 years.
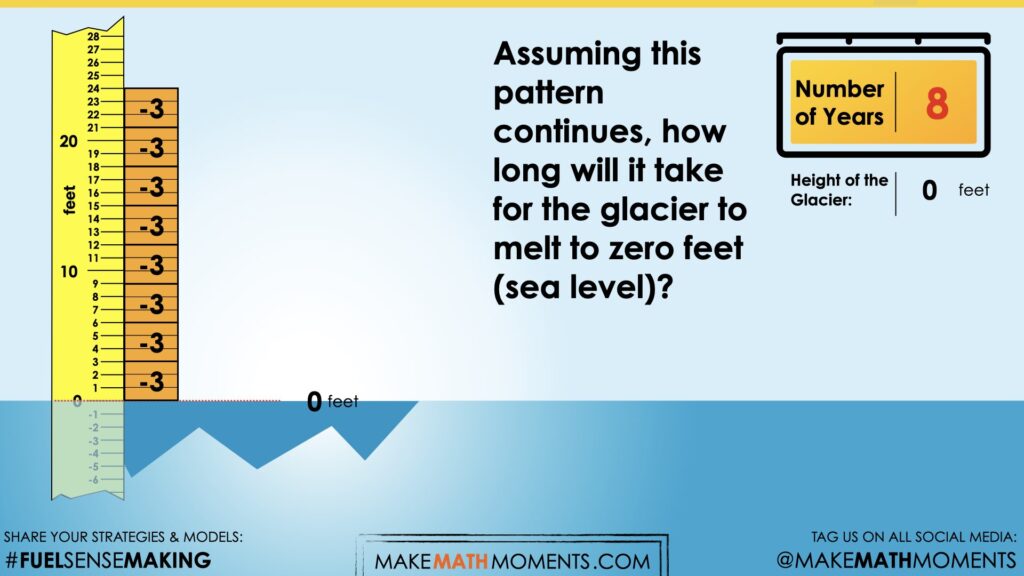
- I wonder how long it will take for the glacier to melt.
- I wonder if it will continue melting at the same rate.
Estimation: Prompt
After we have heard students and demonstrated that we value their voice, we can land on the first question we will challenge them with:
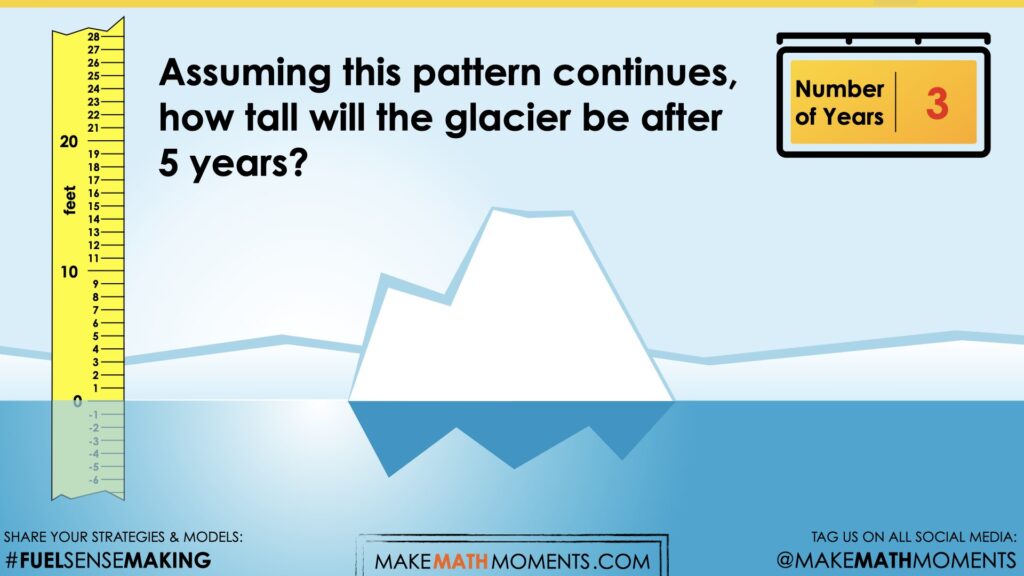
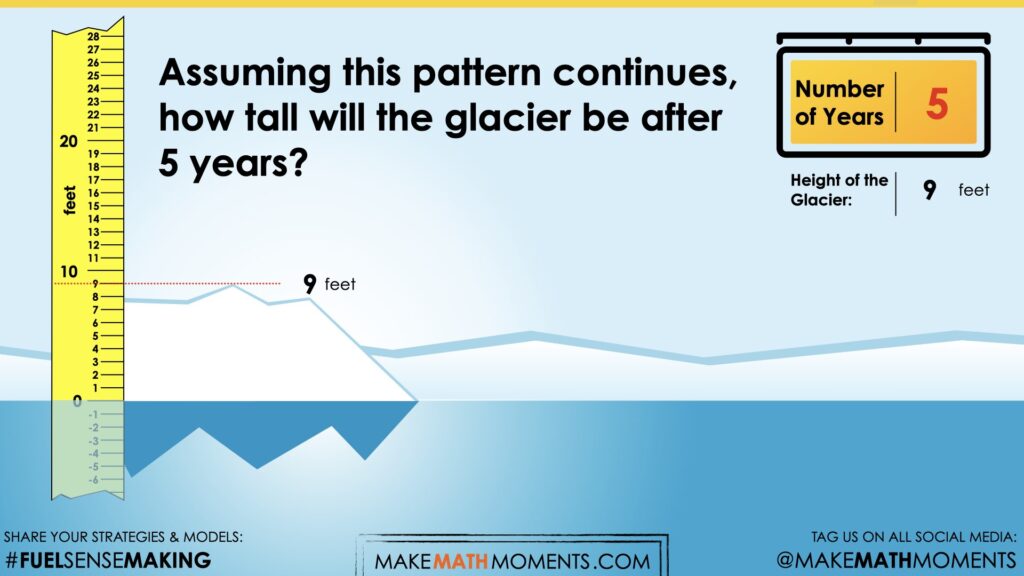
Assuming this pattern continues, how tall will the glacier be after 5 years?
We can now ask students to make an estimate (not a guess) as we want them to be as strategic as they can possibly be. This will force them to determine a reasonable height after 5 years. Students will likely leverage the rate of -3 feet per year. Give them a chance to discuss with a partner before sharing their answer with the larger group.
The intentionality behind this estimation prompt and the reveal that is to follow is to reinforce the iterative (multiplicative) approach, which can help set the stage for students to begin leveraging a rule (or equation) to determine the number of years it will take for the height to reach 0 feet.
Estimation: Reveal
Show students the following video.
Fuel Sense-making
During Moves
While Students Are Productively Struggling…
Monitor student thinking by circulating around the room and listening to the mathematical discourse.
Select and sequence some of the student solution strategies and ask a student from the selected groups to share with the class from:
- most accessible to least accessible solution strategies and representations;
- most common/frequent to least common/frequent strategies and representations; or,
- choose another approach to selecting and sequencing student work.
The tools and representations you might see students using to convince their peers and/or the teacher include:
- Counting back by 3 feet.
- Constructing a table of values relating height above sea level and number of years.
- Trial and error leveraging partial products (i.e.: 5 years x [-3 feet] + 2 years x [-3 feet] + … etc.)
- Leveraging quotative division such as -24 feet ÷ (-3 feet per year) to determine the number of years it would take.
- Constructing an equation such as H = 24 – 3n where H represents the height above sea level in feet and n represents the number of years of elapsed time.
- Or other tools, representations and strategies.
Have students share their strategies and reasoning for how to represent the number of years. Ask them to convince you and their peers that their answer is correct by sharing mathematical models.
Discuss their strategies and elicit student thinking during your consolidation to build off of their current prior knowledge and understanding rather than “fixing” or “funnelling” student thinking to a strategy and/or model that does not connect to their strategy and/or approach.
Student Approaches
Student Approach #1: Skip Counting Backwards in a Ratio Table
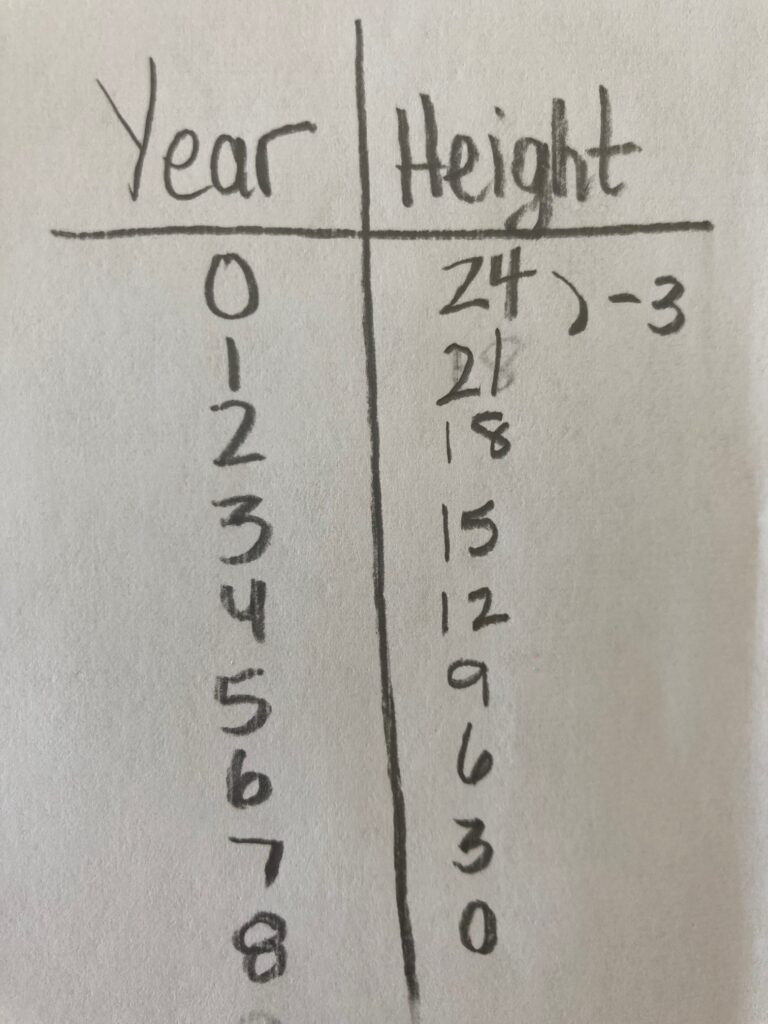
I made a table to show the years and the height. I started at 0 years and 24 feet. I counted back by 3 until I got to 0 feet, which was 8 years.
Student Approach #2: Difference and Quotative Division
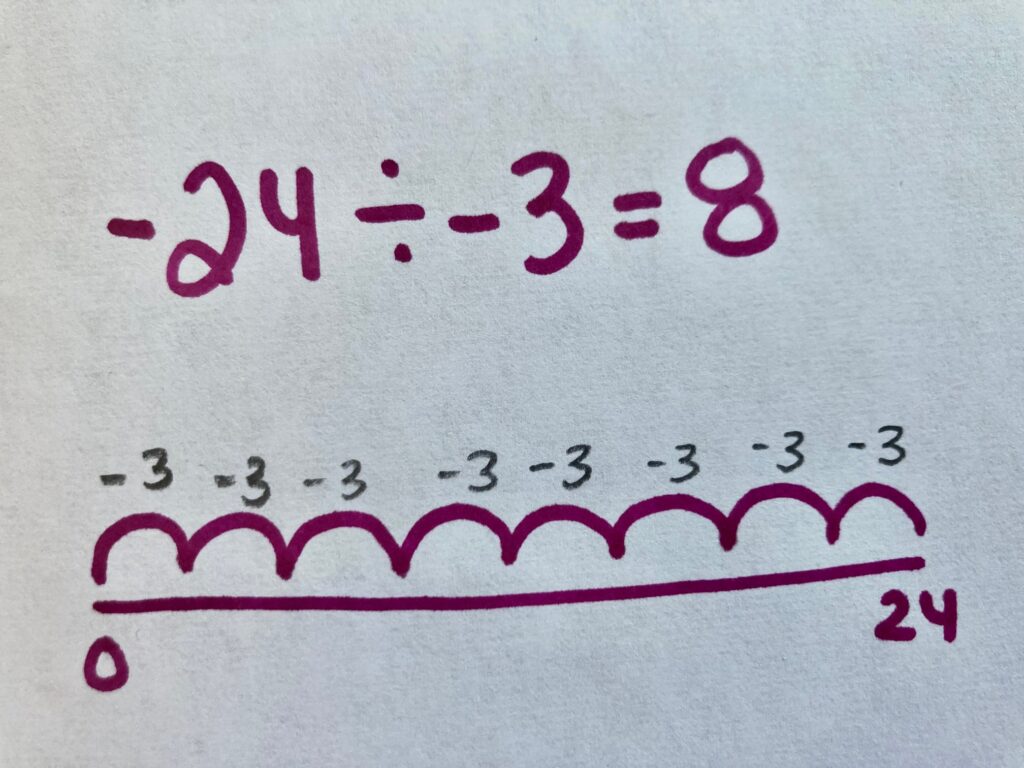
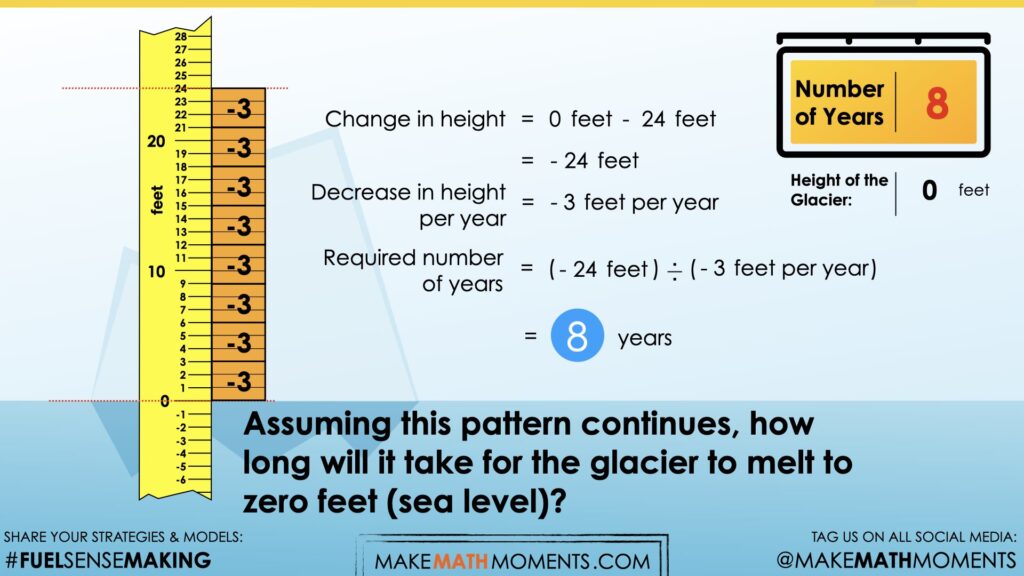
I know that the change is equal to -24 feet. The glacier has to melt -24 feet to get to zero. I know that the glacier is decreasing by -3 every year. So I divided -24 by -3 feet per year (how many copies of -3 are in -24), and the answer is 8. I showed this on a number line to prove it. So it will take 8 years to reach zero feet.
Student Approach #3: Equation with Cancelling
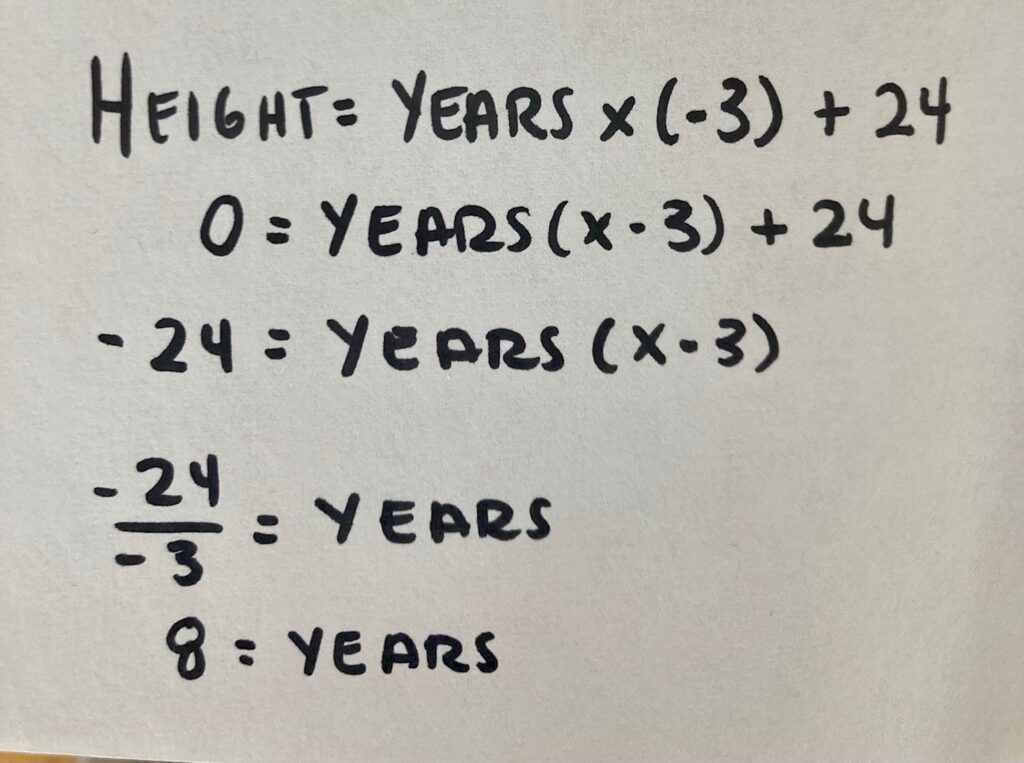
I wrote down what I know about this relationship. I know that the height is equal to the number of years multiplied by -3 feet per year (the rate). But I also have to factor in the original 24 feet. So I wrote an equation. Height = years x (-3) + 24. I used this equation to solve for 0 years. I knew that I needed both sides to be equal. So I started by cancelling 24 feet on both sides. Then I divided the left side by -3, which left me with 8 years.
Next Moves
Consolidation
Consolidate your intentionally selected student solutions. Look for similarities in students’ approaches along the developmental continuum of counting, to addition and eventually, leveraging the relationship between x and y, or the general term.
Consider how students went about extending this pattern to zero feet.
Students likely noticed that this pattern has a rate of -3 feet per year and an initial value of 24 feet.
This pattern can be described in words as, start at 24, subtract three each time. Or, multiply the year by -3, and add 24.
In this video, we ask ourselves, how many copies of -3 are in a difference of -24 feet. This is an example of quotative division of negative integers, and can be represented as:
-24 feet (-3 per year) = 8 years
Reflect and Consolidation Prompts
Provide students an opportunity to reflect on their learning by offering this consolidation prompt to be completed independently.
Consolidation Prompt #1:
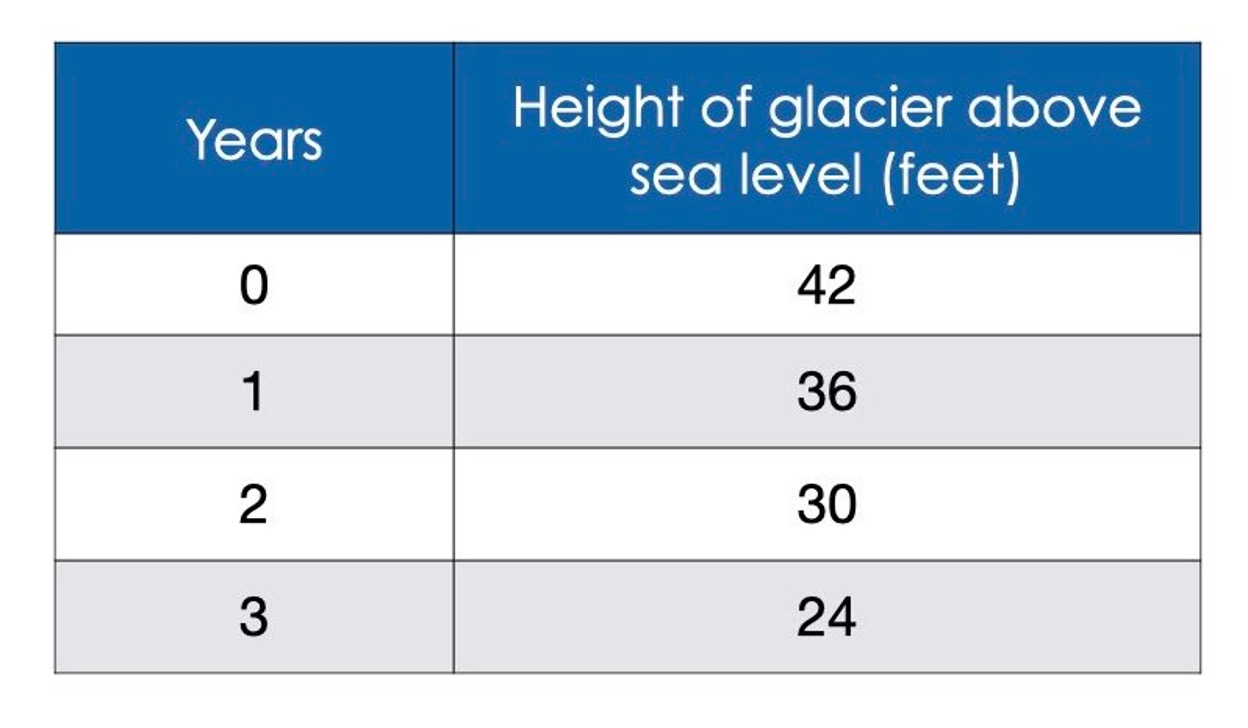
Consider the pattern below.
Assuming this pattern continues, when will the height of the glacier be at sea level? Justify your answer.
Consolidation Prompt #2:
How does a negative rate impact a linear pattern?
Consolidation Prompt #3:
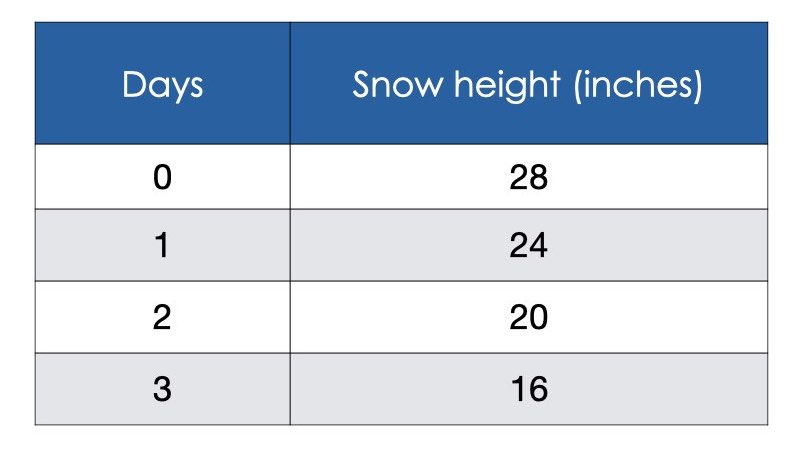
Consider the pattern below.
Assuming this pattern continues, when will the snow measure 4 inches high? Justify your answer.
We suggest collecting this reflection as an additional opportunity to engage in the formative assessment process to inform next steps for individual students as well as how the whole class will proceed.
Resources & Downloads
Educator Discussion Area
Login/Join to access the entire Teacher Guide, downloadable slide decks and printable handouts for this lesson and all problem based units.
Explore Our 60+ Problem Based Units
This Make Math Moments Lesson was designed to spark curiosity for a multi-day unit of study with built in purposeful practice, number talks and extensions to elicit and emerge strategies and mathematical models.
Dig into our other units of study and view by concept continuum, grade or topic!


