BEAR BUILDER [DAY 2]

CALCULATING PERCENT

Create and draw bears that vary in size

Intentionality

Math Talk

Visual Math Talk Prompt #1

Visual Math Talk Prompt #2

Purposeful Practice

Resources & Downloads

Educator Discussion Area

Intentionality & Unit Overview

Length of Unit: 5 Days

Access each lesson from this unit using the navigation links below

Students will continue exploring the relationship between the area of rectangles and the array model. The array replaces the need to count individual units and makes it possible to calculate an area.

Intentionality…

The purpose of the Day 2 activities is to reinforce key concepts from Day 1. Students will engage in a string of related problems through a math talk and will have an opportunity to complete independent purposeful practice. The math talk and purposeful practice serve to develop a deeper understanding of the following big ideas:

  • Percent is a comparison measured out of 100;
  • To solve percent related problems we can use the following strategies: 
    • Analyze Between and Within Ratios (Scaling Up or Down);
    • Find a Unit Rate
    • Use y = kx

Math Talk

Present the following percent problems one at a time (use the visual prompts). Encourage students to describe where the values should be placed along a number line.

This first set of problems was selected to emerge benchmark comparisons and scaling in tandem strategies. Consider modelling student thinking using a double number line.

The second set of problems also promotes the use of a benchmark strategy, however the last problem encourages the use of a unit rate strategy.

10% of 30

20% of 30

5% of 30

15% of 30


10% of 75

15% of 75

65% of 75

33% of 75

Consider watching this silent solution animation to help you prepare to facilitate this math talk utilizing a double number line.

Visual Math Talk Prompt #1

Show students the following visual math talk prompt and be prepared to pause the video where indicated:


Then ask students:

How much will the percent-machine output?

Where along the number line should the output be placed?

Where should each input be placed on the numberline?

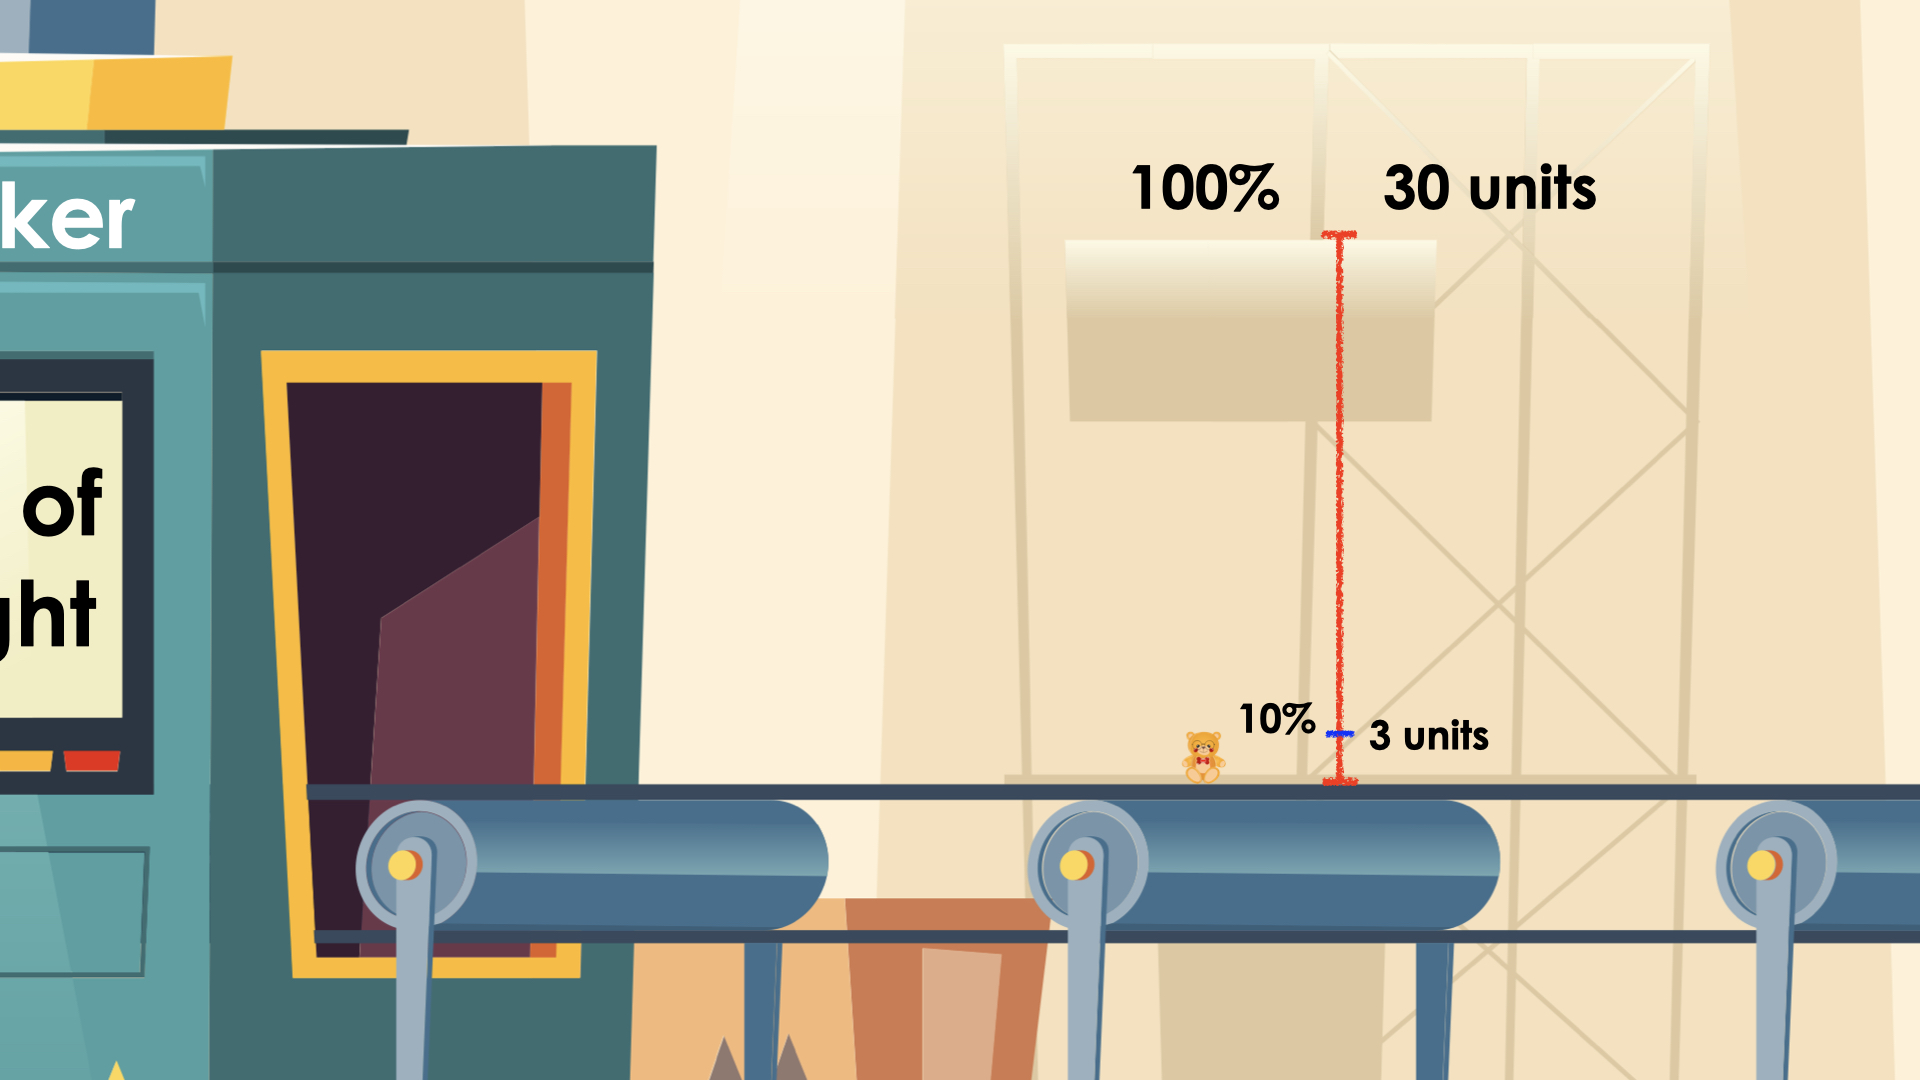
Similar to Day 1 of the Bear Builder problem based unit, students will use the percentage of 10% to determine 10% of 30. 

Since we are aiming to build fluency and flexibility working with percent by using multiplication and division we are going to ensure students are not leveraging the calculator as a tool.

As the facilitator, we are going to do our best to work from a double number line to highlight the strategies students use to determine the percent value.

Some students will choose to place benchmarks along their number line like 50% by using a halving strategy. They may then break the bottom half of the number line up into five 10% sections revealing that each 10% is 3 units and each 5% is 1.5 units. 

Percent number talk

Of course, these visuals can support your facilitation of this visual number talk, but it would be most effective if the facilitator draws the models both as arrays or area models and represents symbolically as the thinking emerges.

Visual Math Talk Prompt #2

Show students the following visual math talk prompt and be prepared to pause the video where indicated:

Then ask students:

How much will the percent-machine output?

Where along the number line should the output be placed?

Where will each input be placed on the numberline?

Again, facilitating this based on student thinking and modelling on the board for all to see is helpful here rather than simply playing the silent solution animation.

While we will model based on whatever approach students would like to use to solve this problem, we do want to ensure that we highlight the idea of using benchmark percentages here as a strategy that students may be able to add to their repertoire of strategies for the future.

Similarly to Visual Math Talk Prompt #1 students may use a halving strategy to show 50% and 25% on the numberline and then switch to a division strategy to break 25% into 5 groups of 5% each. 

Percent number talk

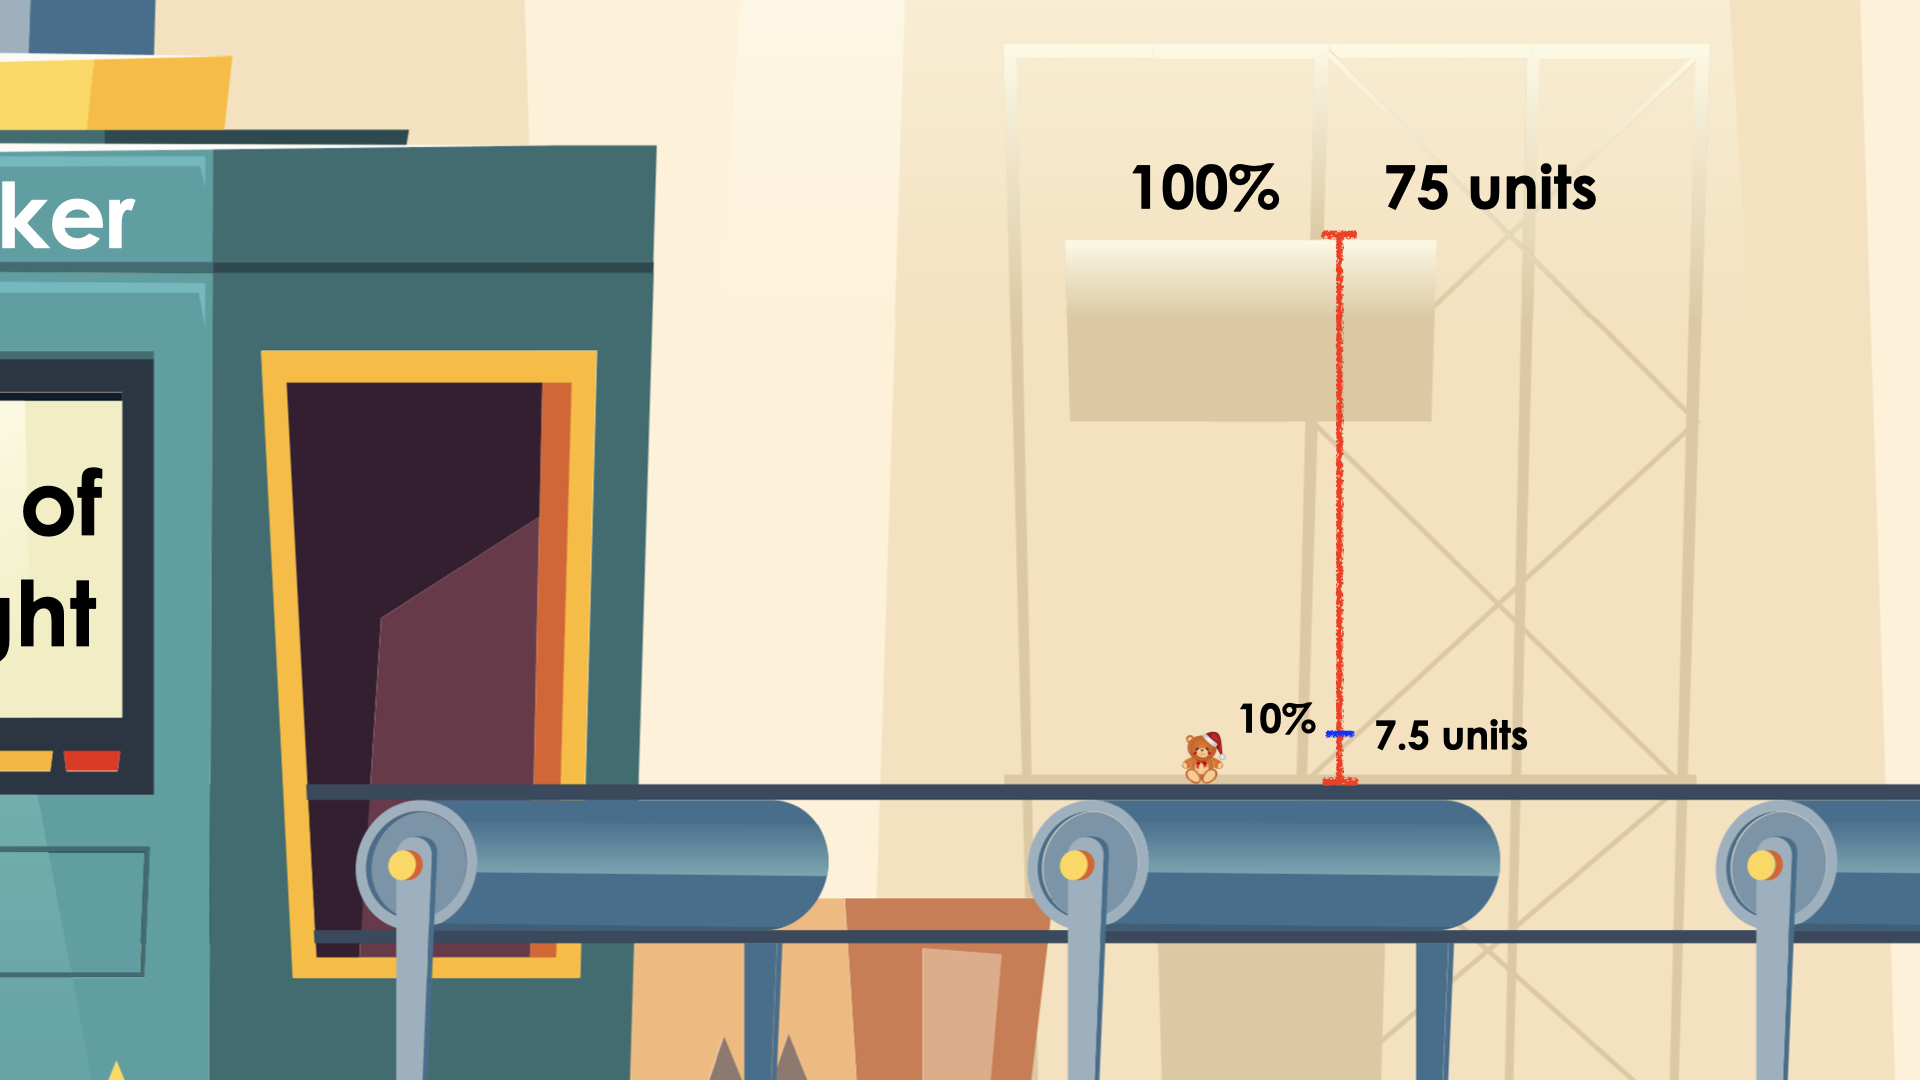
When students approach 33% of 75 they may break their 5% group up into five 1% each groups (unit rate) and then scale the 1% group to 33%. 

Again, we do not want to limit students from leveraging other strategies, however we do want them to recognize that certain strategies may be more helpful than others in particular situations

Purposeful Practice

While Students Are Practicing…

Login/Join to access the entire Teacher Guide, downloadable slide decks and printable handouts for this lesson and all problem based units.

Purposeful Practice

Login/Join to access the entire Teacher Guide, downloadable slide decks and printable handouts for this lesson and all problem based units.

We suggest collecting this reflection as an additional opportunity to engage in the formative assessment process to inform next steps for individual students as well as how the whole class will proceed.

Resources & Downloads

Login/Join to access the entire Teacher Guide, downloadable slide decks and printable handouts for this lesson and all problem based units.

Printable Lesson Plan PDF

Videos, Images & Media Files

Apple Keynote Presentation

Powerpoint Presentation

Printable Consolidation Prompts

Educator Discussion Area

Login/Join to access the entire Teacher Guide, downloadable slide decks and printable handouts for this lesson and all problem based units.

Explore Our 60+ Problem Based Units

This Make Math Moments Lesson was designed to spark curiosity for a multi-day unit of study with built in purposeful practice, number talks and extensions to elicit and emerge strategies and mathematical models.

Dig into our other units of study and view by concept continuum, grade or topic!