AT THE CARNIVAL
SOLVING INEQUALITIES
Investigate, solve and graph inequalities.
Intentionality
Spark Curiosity
Fuel Sensemaking
During Moves
Student Approaches
Consolidation
Reflect and Consolidation Prompts
Resources & Downloads
Educator Discussion Area
Intentionality & Unit Overview

Length of Unit: 5 Days
Access each lesson from this unit using the navigation links below
Students will explore the concept of inequalities and represent their solutions on a number line.
Learning goals:
- We will solve inequalities that involve one operation and whole numbers up to 50.
- We will graph our solutions.
Intentionality…
In this task, students will begin exploring inequalities in contexts involving whole numbers up to 50. On Day 1, students will explore the idea of greater than, less than, and equal to. They will graph the solutions on a number line. Some of the big ideas that may emerge in today’s lesson include:
- In an inequality, the two expressions are not necessarily equal, which can be indicated by the symbols: >, <, ≤ or ≥.
- A number line can show the values that hold for an inequality.
An open dot on a number line is used when an inequality involves “less than” or “greater than”, and a closed dot is used when it also includes “equal to”.
Spark Curiosity
What Do You Notice? What Do You Wonder?
Show students the following video:

Then, ask students:
What do you notice?
What do you wonder?
Give students 60 seconds (or more) to do a rapid write on paper.
Then, ask students to share with their neighbours for another 60 seconds.
Finally, allow students to share with the entire group.
Some of the noticing and wondering that came up in a class recently included:
- I notice this is a carnival or a fair.
- I notice it might be an amusement park.
- I notice there are different types of rides.
- I notice a Ferris wheel.
- I notice there is a height sign.
- I notice you have to be 40 inches tall to ride.
- I wonder if there is a height maximum.
- I wonder how much it costs to ride.
At this point, you can answer any notices and wonders you can cross off the list immediately. For example, this is a carnival. The cost to ride the Ferris Wheel is $3.00/person. There is no maximum height requirement for this ride.
Fuel Sense-making
Crafting A Productive Struggle: Prompt
Since you have already taken some time to set the context for this problem and student curiosity is already sparked, we have them in a perfect spot to help push their thinking further and fuel sense-making. Share the following silent animation. You can verbally share the following prompt with students:
Have a look at this sign for the children’s carousel. The height requirements for this ride are interesting. Determine the possible heights for each of the categories below:
- Not tall enough to ride
- Can ride with an adult
- Can ride alone
- Too tall to ride
During Moves
While Students Are Productively Struggling…
Monitor student thinking by circulating the room and listening to the mathematical discourse. Select and sequence some of the student solution strategies and ask a student from the selected groups to share with the class from:
- most accessible to least accessible solution strategies and representations;
- most common misconceptions;
- most common/frequent to least common/frequent representations; or,
- choose another approach to selecting and sequencing student work.
The strategies you might see students use include:
- Writing out all the heights in a list.
- Recording the heights in a table.
- Recording the heights on a number line.
As you are circulating, ask focusing questions that will prompt students to find a way to model all the heights efficiently. There are more efficient and organized ways to answer this question than writing a list of all the possible solutions.
Our goal for this lesson is to move students towards using a number line to represent all possible solutions to an inequality.
Listen for the use of language such as equal to, greater than, and less than.
Student Approaches
Student Approach 1: A List

I made a list of all the different heights for each category. In the heights for not tall enough, it is every number from 1 – 35. Once the child is 36 inches tall, they can ride with an adult. For each category, I just wrote all the numbers.
Once I got to “too tall to ride”, I figured there were too many numbers to write, so I only wrote the first few. It’s any height taller than 52.
Student Approach 2: A Table

I used a table to show the different heights for this ride. I realized there were a lot of heights that were too short and too tall, so I used the … to show any height that comes before and any height that comes after.
Student Approach 3: A Numberline
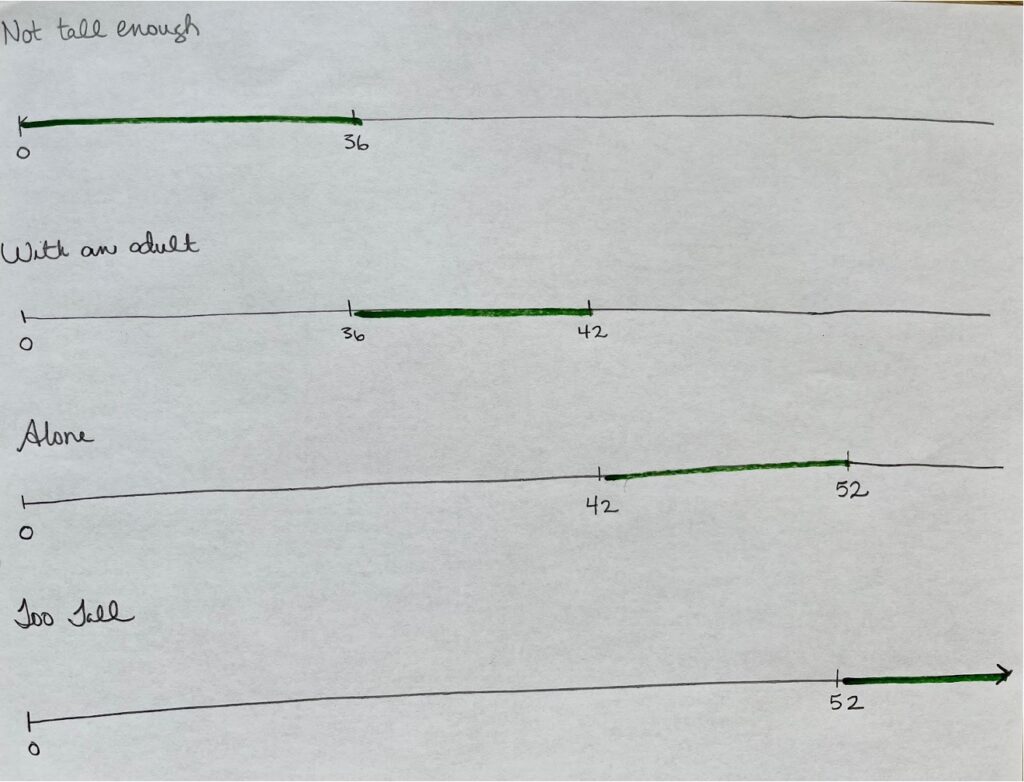
I used open-number lines to show each category’s range of heights. One thing I needed clarification on was the heights that are between categories. For example, if a child is 42 inches tall, do they ride alone or with a parent? They can ride alone, but my first number line also showed 42. I wanted to stop my line just before 42, but it was hard to show that clearly.
Consolidation
This consolidation aims to help students leverage the number line to model the solution to an inequality.
Focus on one or two categories, leveraging student thinking, and model the solutions on a number line. Engage in a conversation about the idea of greater than, less than, and ensure that students are familiar with the symbols.
For example – not tall enough to ride.
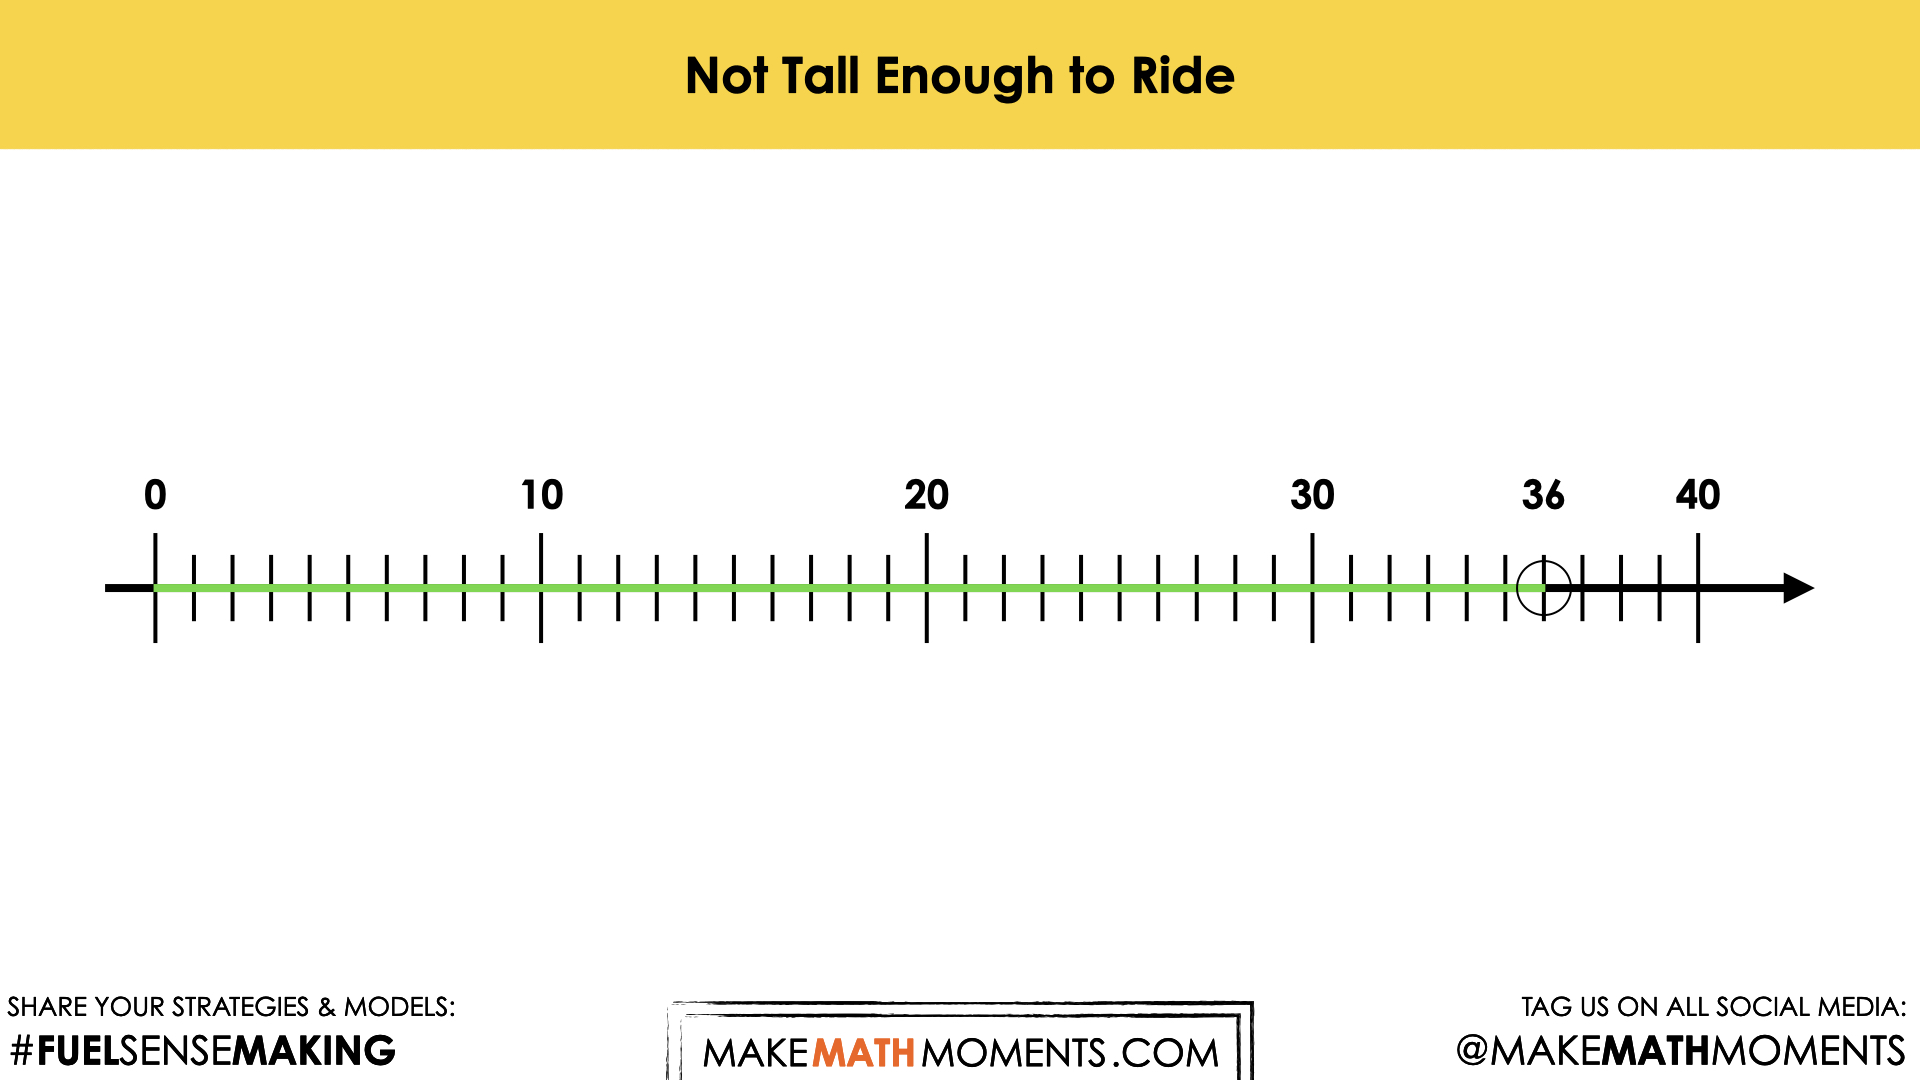
In this scenario, c < 36. Riders less than 36 inches cannot ride. Share the symbolic representation of this inequality with students.
We use an open circle to show that 36 is not included in this data set. Discuss how this model would differ if the range included children 36 inches tall. This inequality would be represented as c ≤ 36. In this scenario, we would place a solid circle on 36.
Facilitator note: We connect the values with a solid line in this graphical representation. This line indicates that the data set is continuous. Riders of any height, between 0 inches and 36 inches, cannot ride, including fractional measures such as 26 ¼ inches.
As a goal for today’s lesson, ensure that students are familiar with the symbols ≤ or ≥. Revisit the learning goals and co-construct any success criteria that emerged.
For example:
- We will solve inequalities that involve one operation and whole numbers up to 50.
- I can use >, <, ≤, or ≥ correctly..
- We will graph our solutions.
- I can show the possible solutions to an inequality on a number line.
- I can use an open dot on a number line when an inequality involves “less than” or “greater than”, and a closed dot is used when it also includes “equal to”.
Reflect and Consolidation Prompts
Provide students an opportunity to reflect on their learning by offering these consolidation prompts to be completed independently.
Consolidation Prompt #1:
What is the difference between the following symbols, < and ≤? Explain. Share an example for each.
Consolidation Prompt #2:
Louisa is committed to running at least 6 kilometers daily to prepare for the cross-country meet. If she ran 2 kilometers before school, how many kilometers would she have to run after school to meet her goal?
Represent your solution on a number line.
We suggest collecting this reflection as an additional opportunity to engage in the formative assessment process to inform next steps for individual students and how the whole class will proceed.
Resources & Downloads
Printable Lesson Plan PDF
Videos, Images & Media Files
Apple Keynote Presentation
Powerpoint Presentation
Printable Consolidation Prompts
Educator Discussion Area
Login/Join to access the entire Teacher Guide, downloadable slide decks and printable handouts for this lesson and all problem based units.
Explore Our 60+ Problem Based Units
This Make Math Moments Lesson was designed to spark curiosity for a multi-day unit of study with built in purposeful practice, number talks and extensions to elicit and emerge strategies and mathematical models.
Dig into our other units of study and view by concept continuum, grade or topic!
