EVERGREEN [DAY 5]
DATA AND FRACTIONS
Dive into this 5-day Problem Based Math Unit focused on displaying a data set of measurements in fractions of a unit.
Intentionality
Math Talk
Visual Math Talk Prompt #1
Visual Math Talk Prompt #2
Visual Math Talk Prompt #3
Assessment
Resources & Downloads
Educator Discussion Area
Intentionality & Unit Overview
Length of Unit: 5 Days
Access each lesson from this unit using the navigation links below
Students will demonstrate the concepts and skills that they have developed through this context and learning experience.
Intentionality…
The purpose of this assessment is for students to demonstrate their understanding of the following big ideas.
- There are different types of data;
- Categorical data refers to a data type that can be identified based on the names or labels given to them;
- Categorical data is either nominal or ordinal;
- Bar graphs are used to compare and contrast numbers, frequencies or other measures of distinct categories of data;
- The numerical values of a data set need to be considered when a scale is chosen;
- A fraction can represent a part of a whole;
- The range is the difference between the lowest and highest values within a data set;
- The range is calculated by subtracting the lowest value from the highest value.
The independent assessment will allow students to demonstrate concepts and skills related to the following learning goals:
- I will draw conclusions about categorical data.
- I will display categorical data that includes measurements in fractions of a unit in a bar graph.
- I will display categorical data that includes measurements in fractions of a unit in a line plot.
- I will interpret bar graphs, line plots and stem and leaf plots.
- I will determine the range of a data set that includes measurements in fractions of a unit.
Students might write and/or model their responses independently. Students can also be interviewed by their teacher.
An alternative assessment opportunity should be offered if this tool will not successfully capture what the student knows, understands or can do.
Math Talk
Present the various ranges below one at a time. For each range, ask students to determine the possible heights of the shortest and tallest tree within each data set.
Model a few student suggested measurements for each range on a number line. Work with students to determine an appropriate scale for the data points that you model. Note that it does not matter which two values are selected, as long as the difference is consistent.
Ranges:
1 \(\frac{3}{4}\)
2 \(\frac{1}{2}\)
3 \(\frac{4}{5}\)
Visual Math Talk Prompt #1
Show students the following visual math talk prompt and be prepared to pause the video where indicated:
Then ask students:
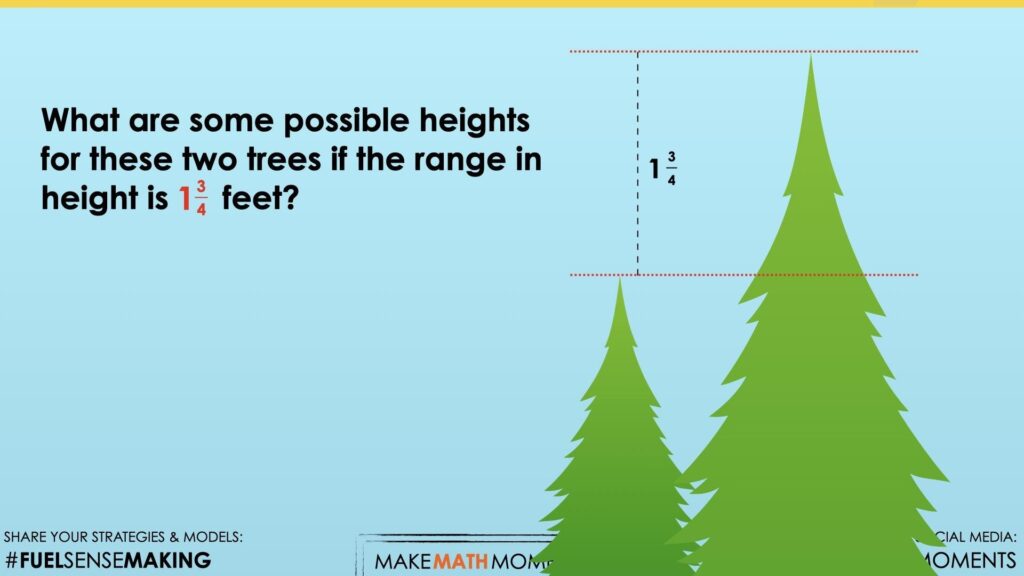
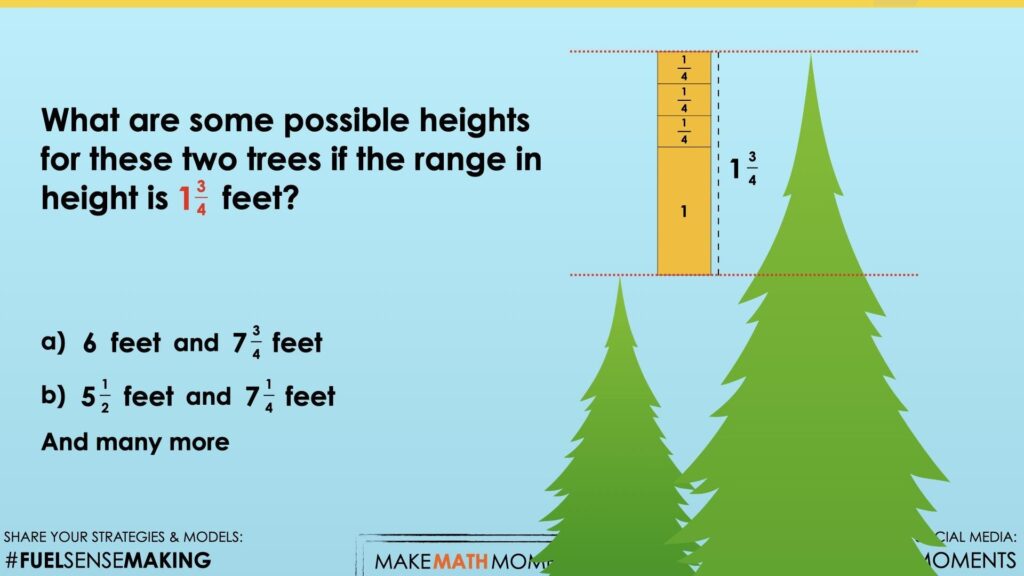
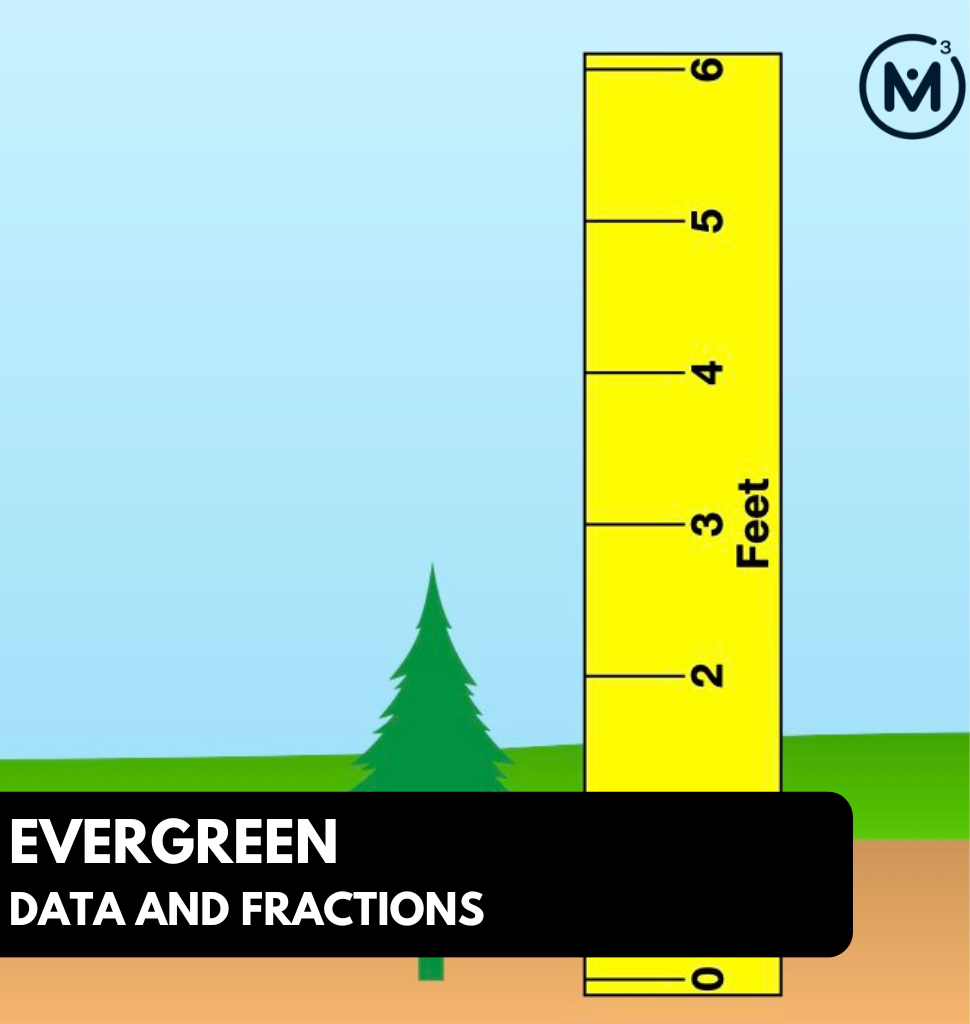
What are some possible heights for these two trees if the range in height is 1\(\frac{3}{4}\) feet?
Give students some time to work through some possibilities and share them with their neighbours.
Some obvious choices would be combinations that have a whole number of feet representing the height of the shorter tree such as 2 feet so that the taller tree would simply be 1\(\frac{3}{4}\) feet taller or 3\(\frac{3}{4}\) feet. Having students who used this strategy share first would be helpful as these would be the most accessible combinations and would be easy to model for all learners.
Ask other students to share other combinations where the shorter tree height is not a whole number of feet tall to encourage other possibilities that may prove to be more challenging to work through.
You might even ask students for a possibility where the taller tree is a whole number of feet, therefore requiring students to subtract 1\(\frac{3}{4}\) feet from that quantity.
Be sure to model the combinations that students share with you and encourage them to explain their thinking so you can attempt making their thinking visible.
In the visual math talk prompt video, you will see the combinations of 6 feet and 7\(\frac{3}{4}\) feet as well as 5\(\frac{1}{2}\) feet and 7\(\frac{1}{4}\) feet modelled using a tape diagram and/or linear model.
Visual Math Talk Prompt #2
Show students the following visual math talk prompt and be prepared to pause the video where indicated:
Then ask students:
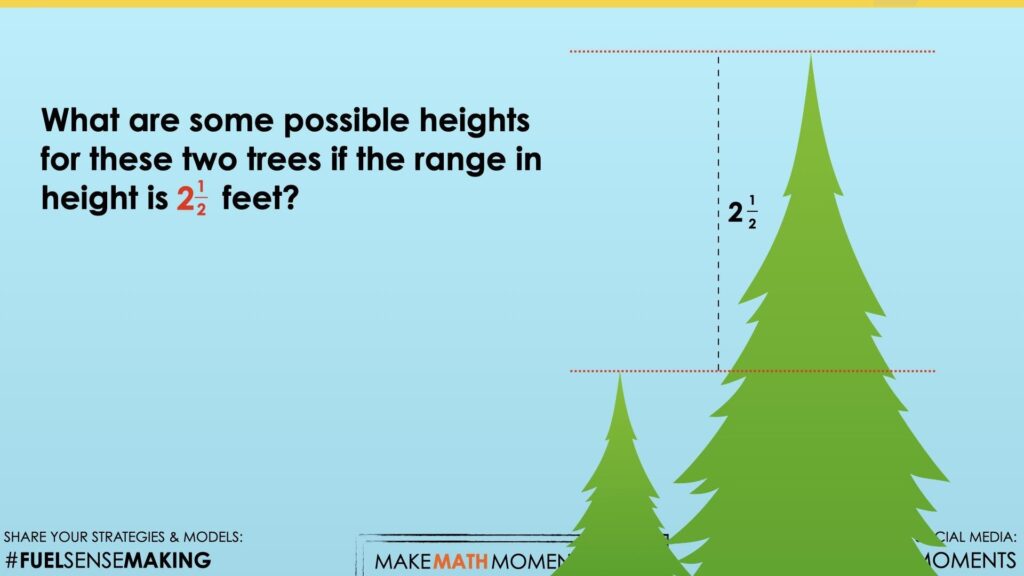
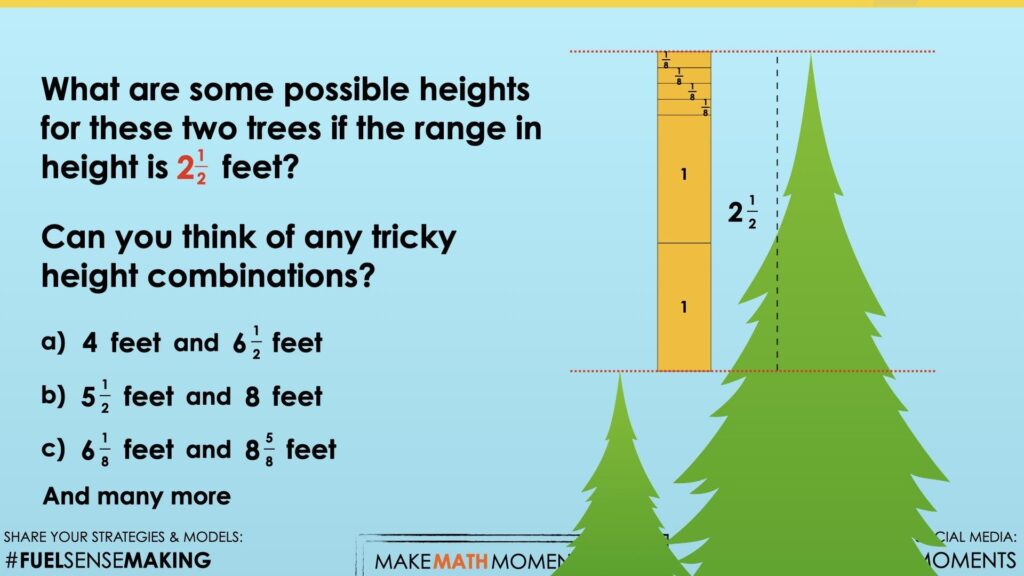
What are some possible heights for these two trees if the range in height is 2 ½ feet?
Can you think of any tricky height combinations?
As shared previously, selecting a whole number in feet to represent the height of the shorter tree would make this exercise relatively simple for some students, therefore this time we will ask them to first think of any combinations they’d like followed by some combinations they might personally feel are “tricky”.
In the silent solution visual number talk prompt video, we give examples of 4 feet and 6\(\frac{1}{2}\) feet, 5\(\frac{1}{2}\) feet and 8 feet, as well as 6\(\frac{1}{8}\) feet and 8\(\frac{5}{8}\) feet.
Visual Math Talk Prompt #3
Login/Join to access the entire Teacher Guide, downloadable slide decks and printable handouts for this lesson and all problem based units.
Assessment
Assessment Considerations…
Login/Join to access the entire Teacher Guide, downloadable slide decks and printable handouts for this lesson and all problem based units.
Assessment: Categorical Data with Fractions
Question #1:
Login/Join to access the entire Teacher Guide, downloadable slide decks and printable handouts for this lesson and all problem based units.
Question #2:
Login/Join to access the entire Teacher Guide, downloadable slide decks and printable handouts for this lesson and all problem based units.
Question #3:
Login/Join to access the entire Teacher Guide, downloadable slide decks and printable handouts for this lesson and all problem based units.
Question #4:
Login/Join to access the entire Teacher Guide, downloadable slide decks and printable handouts for this lesson and all problem based units.
Considerations to Promote Student Growth
Login/Join to access the entire Teacher Guide, downloadable slide decks and printable handouts for this lesson and all problem based units.
Resources & Downloads
Login/Join to access the entire Teacher Guide, downloadable slide decks and printable handouts for this lesson and all problem based units.
Printable Lesson Plan PDF
Videos, Images & Media Files
Apple Keynote Presentation
Powerpoint Presentation
Printable Consolidation Prompts
Educator Discussion Area
Login/Join to access the entire Teacher Guide, downloadable slide decks and printable handouts for this lesson and all problem based units.
Explore Our 60+ Problem Based Units
This Make Math Moments Lesson was designed to spark curiosity for a multi-day unit of study with built in purposeful practice, number talks and extensions to elicit and emerge strategies and mathematical models.
Dig into our other units of study and view by concept continuum, grade or topic!


