OLYMPICS REVISITED
DATA LITERACY
In this unit, students will analyse different sets of data from various Olympic events, including data represented in misleading graphs. Students will explore the impact of adding or removing data from a data set on a measure of central tendency.
Intentionality
Spark Curiosity
Fuel Sensemaking
During Moves
Student Approaches
Next Moves
Consolidation
Reflect and Consolidation Prompts
Resources & Downloads
Educator Discussion Area
Intentionality & Unit Overview
Length of Unit: 5 Days
Access each lesson from this unit using the navigation links below
Students will ask and answer questions about the graphical representations of javelin throws for two competitors at the Olympics. They will challenge preconceived notions about the representation and draw conclusions. Students will explore how scale drastically impacts the audience’s initial notion of the results.
Intentionality…
The distance of six javelin throws for two competitors are represented in value-bar graphs. Students will make initial assumptions about the results. However, upon further investigation, students will realize that the interval for the scale selected in each graph differs. This change in the graphical representation will impact the students’ preconceived notions about the results of this event. Students will then represent the results of a third javelin thrower using a graph and scale of their choice. Some of the big ideas that may emerge in this lesson include;
- There are different types of data;
- Data is often characterized as continuous or discrete;
- Discrete data is often countable and can only take on certain values;
- Continuous data is measurable and can take any value (within a range);
- Scale in graphs are the system of marks at fixed intervals;
- The intervals can be unitized;
- Changing the interval selected for a scale can impact the audience’s initial notion of the data; and,
- The range of a set of data is the difference between the highest and lowest values in the set.
Spark Curiosity
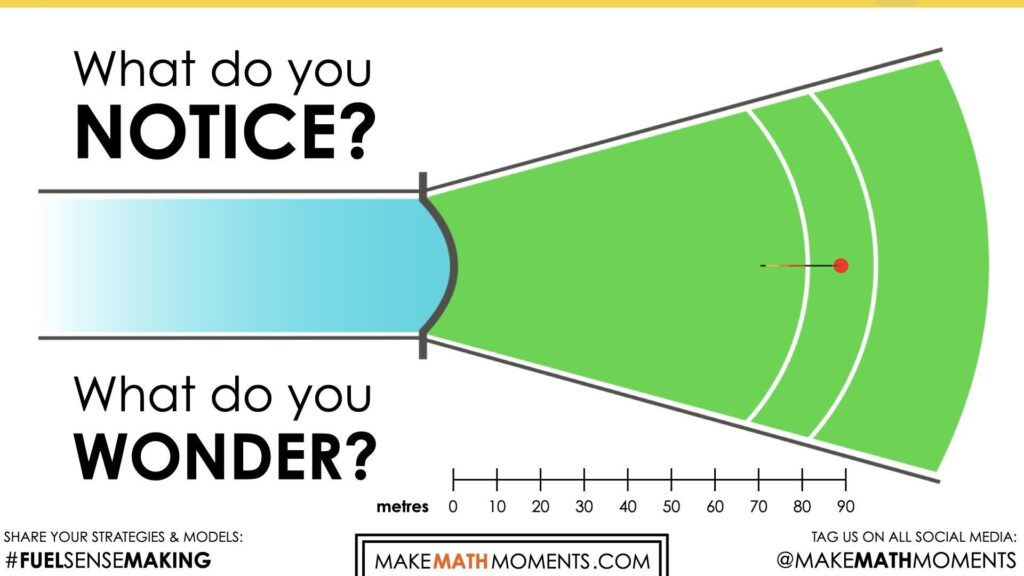
What Do You Notice? What Do You Wonder?
Show students this video:
Then, ask students:
What do you notice?
What do you wonder?
Give students 60 seconds (or more) to do a rapid write on a piece of paper.
Then, ask students to share with their neighbours for another 60 seconds.
Finally, allow students to share with the entire group.
Some of the noticing and wondering that came up in a class recently included:
- I notice some type of field.
- I notice something being thrown and landing.
- I notice a scale below, it goes up by 10.
- I wonder if this is a sport.
- I wonder if the scale is in feet or metres.
- I wonder where it landed.
At this point, you can answer any notices and wonders that you can cross off the list right away. Share the following information:
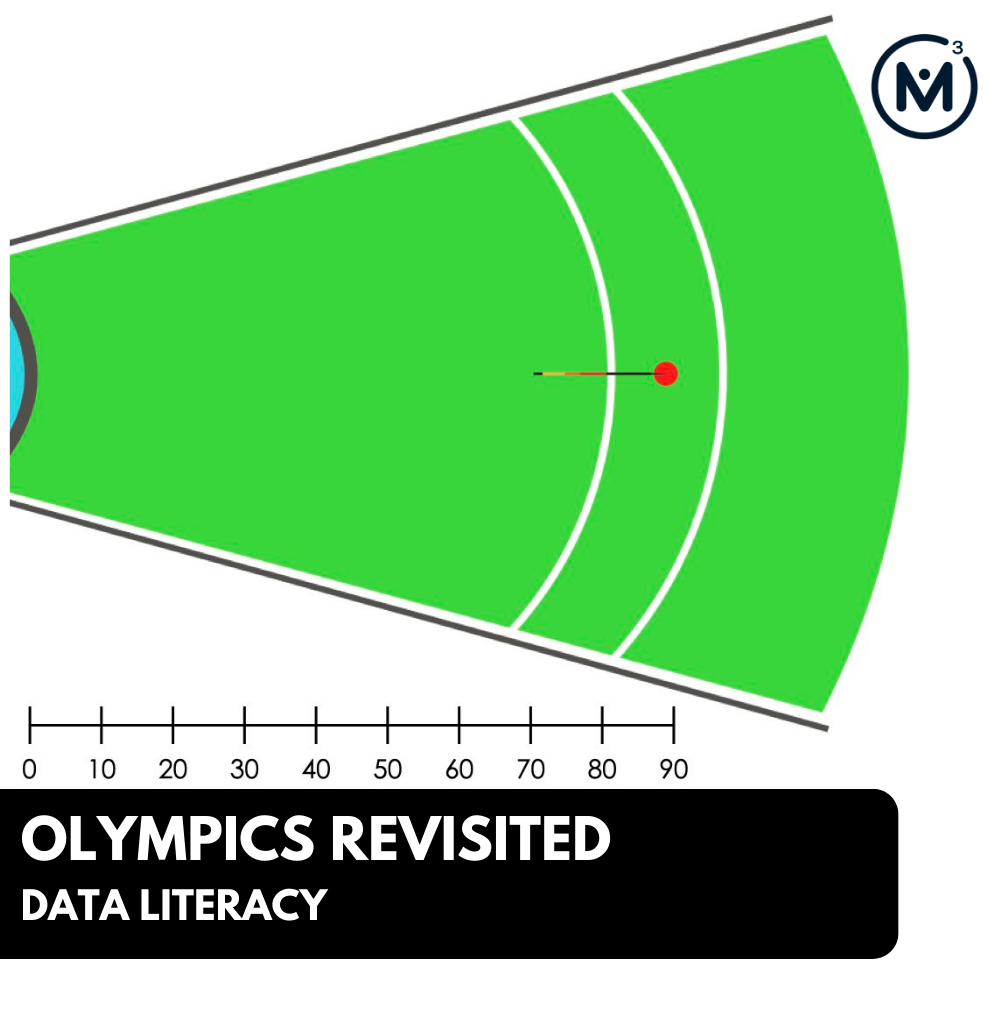
This is an animation of a Javelin throw runway and landing sector. Javelin throw is part of the athletics (track-and-field) sport. It is a sport where athletes throw a spear called a javelin for distance. Each throw is measured from the throwing arc to the point of impact. The distance is measured in metres.
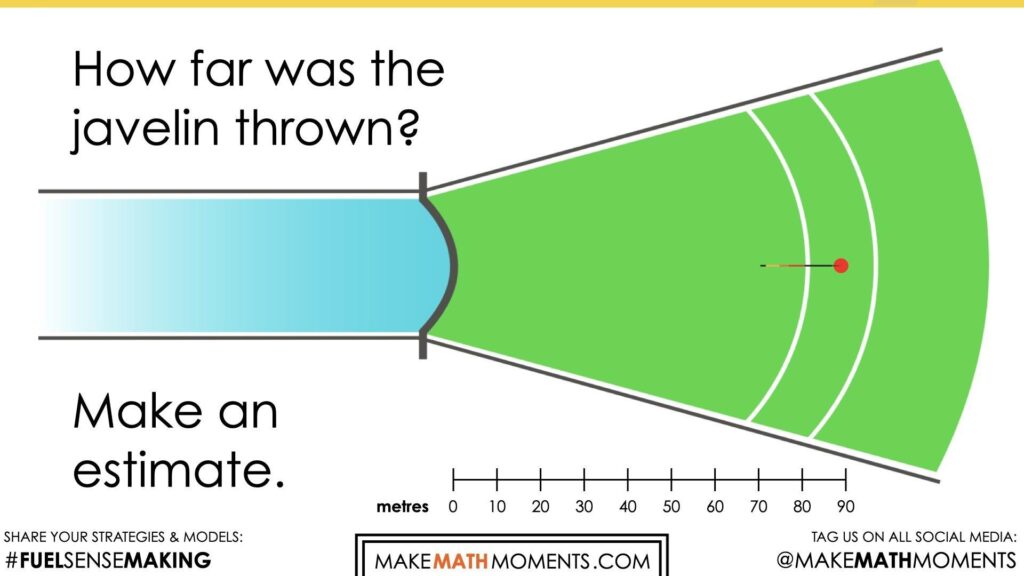
Estimate: Prompt
Student prompt:
How far was this javelin thrown?
Make an estimate.
We can now ask students to make an estimate (not a guess) as we want them to be as strategic as they can possibly be. This will force them to use reasoning to try and come up with a reasonable distance for this throw.
Consider asking students to think about a number that would be “too low” and a number that would be “too high” before asking for their best estimate in order to help them come up with a more reasonable estimate.
Let them chat with their neighbours and challenge them to an estimation duel or a math fight.
Also consider asking students:
How might you make your estimate more precise?
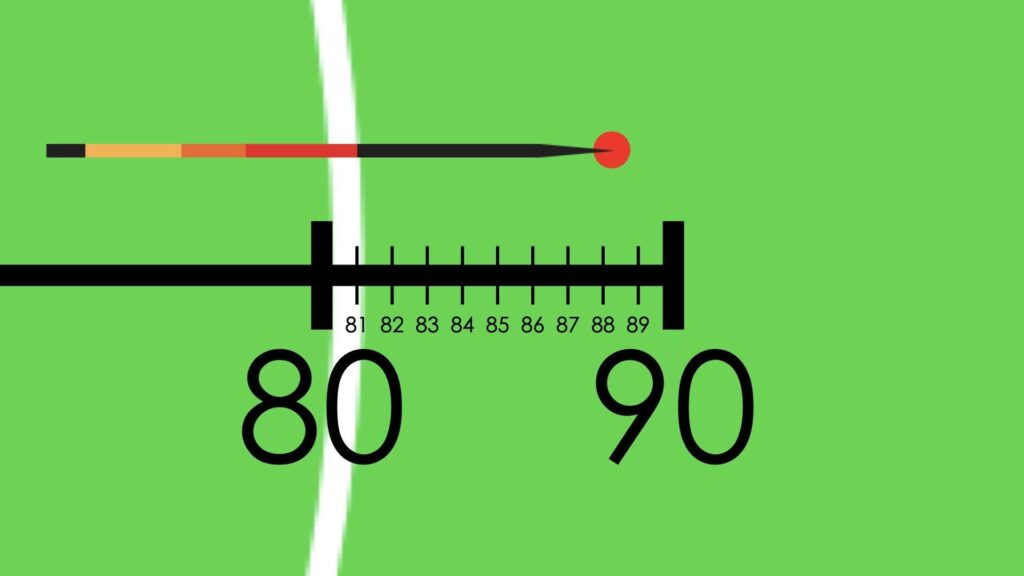
Students might recommend moving the scale upwards or zooming in to get a better look.
Update Estimate: Prompt
Student prompt:
Update your estimate.
We can now ask students to update their estimate.
While Students Are Estimating…
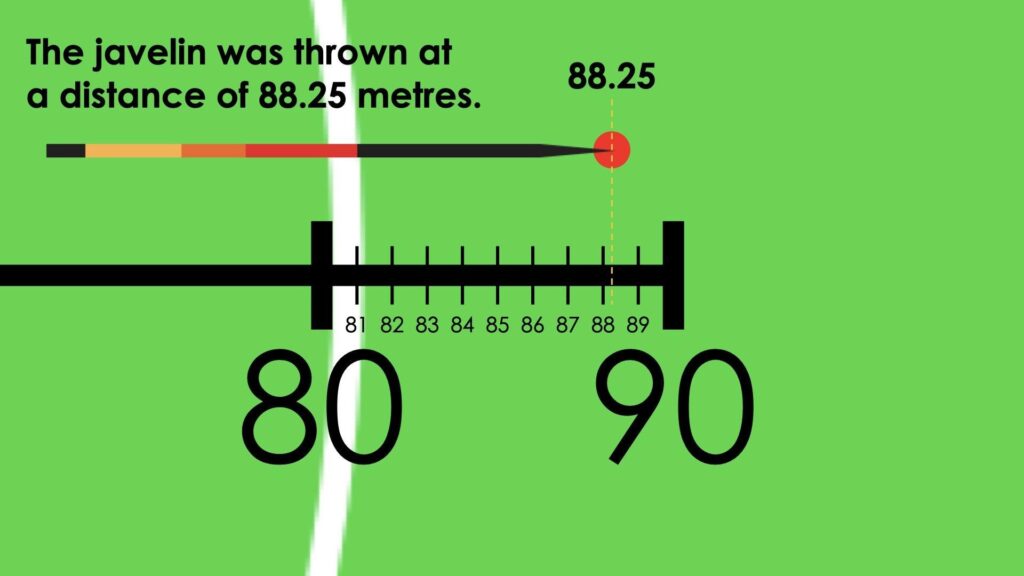
Monitor student thinking by circulating around the room and listening to the mathematical discourse. Encourage students to use precise mathematical language and listen for the use of fractional language. Are students considering the relationship between the point of impact and the scale, noticing that the throw is less than halfway between 88 and 89 metres. How are students describing this distance? 88 and one-fourth of a meter? 88 metres and 25 centimetres? 88.25 metres?
Allow students to share their estimates with neighbours first, then with the class. Write down their estimates on the chalkboard/whiteboard/chart paper so students feel their voices are being heard and so they feel they have a stake in solving this problem.
Estimation Reveal
Share the following image with students to reveal the actual distance of this throw.
Fuel Sense-making
Crafting A Productive Struggle: Prompt #1
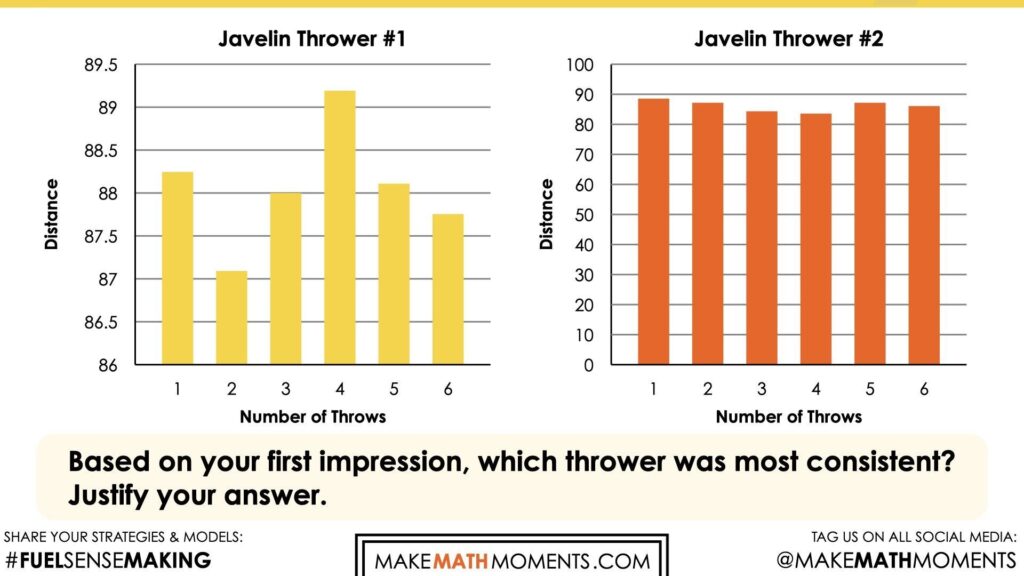
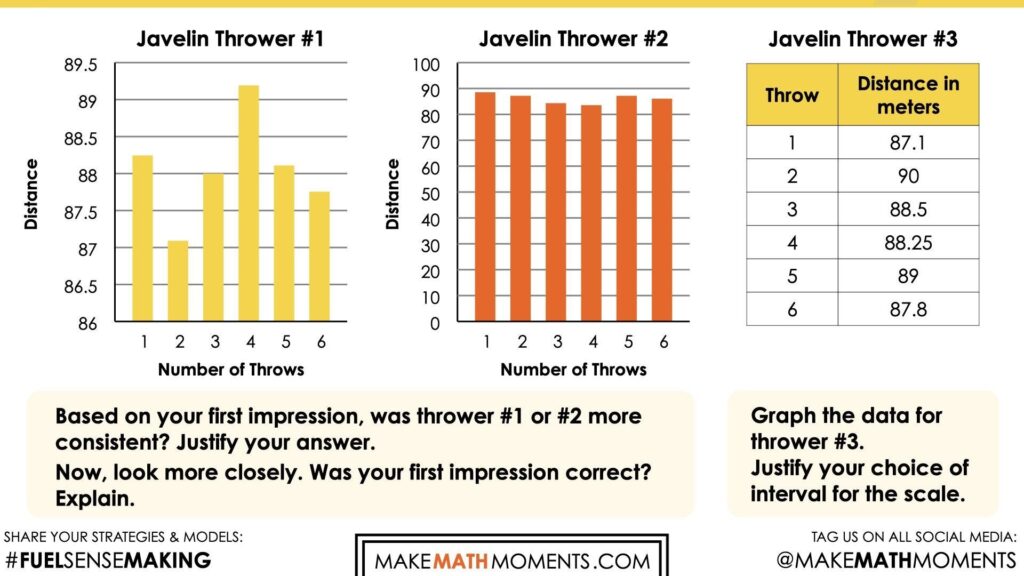
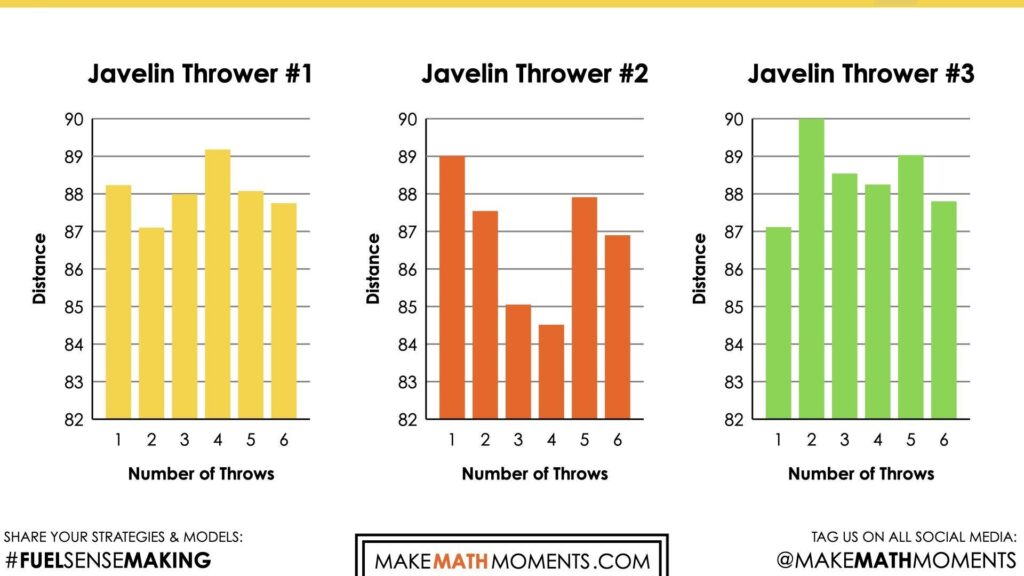
Share the following graphs with students.
Explain that the two value-bar graphs represent the six throws of two different male competitors in the javelin throw at the Olympic games.
Student prompt:
Based on your first impression, which thrower was most consistent? Justify your answer.
Allow students some time to discuss and share what they see.
Then, prompt students with:
Now, look more closely. Was your first impression correct? Explain.
Crafting A Productive Struggle: Prompt #2
Student Prompt:
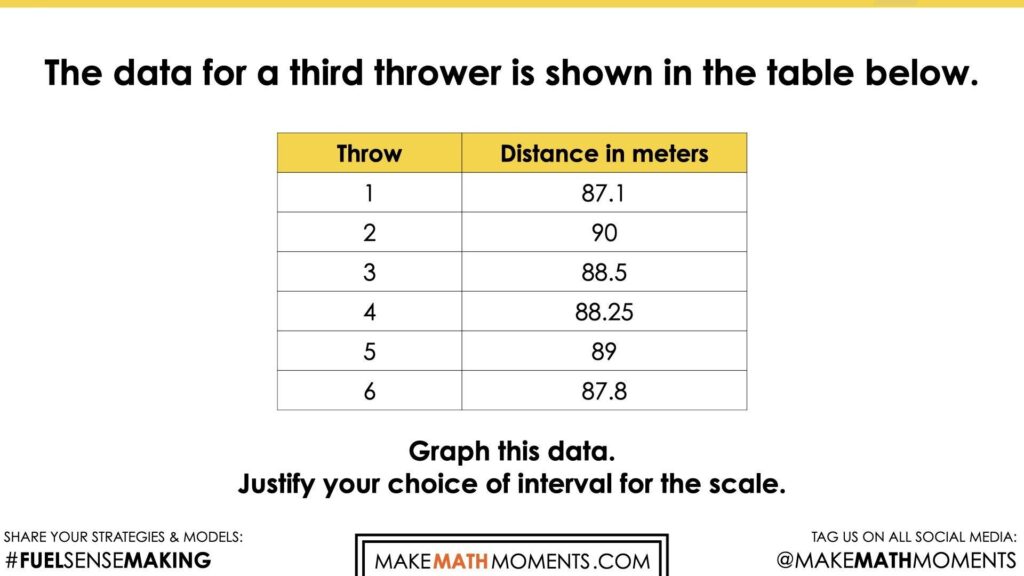
The data for a third thrower is shown in the table below.
Graph this data.
Justify your choice of interval for the scale.
During Moves
While Students Are Productively Struggling….
Monitor student thinking by circulating around the room and listening to the mathematical discourse. Select and sequence some of the student solution strategies and ask a student from the selected groups to share with the class from:
- most accessible to least accessible solution reasoning and representations;
- most common misconceptions;
- most common/frequent to least common/frequent justifications and/or representations; or,
- choose another approach to selecting and sequencing student work.
If you see students using another graphical representation such as a line graph, a histogram, or a circle graph, this would be a great opportunity to sit and conference. Engage students in a conversation about the purpose of the graph and the characteristics of this data set.
Have students share their answers to the questions about the first two graphs and to justify the interval selected for the scale for the third thrower.
Discuss their thinking during your consolidation to build off of their current prior knowledge and understanding rather than “fixing” or “funnelling” student thinking to a representation and justification that does not connect to their understanding.
Student Approaches
Sample Student Responses
1a. Based on your first impression, which thrower was most consistent? Justify your answer
Students will likely notice that the first graph shows greater variation between the bars, suggesting that the distance of each throw varied significantly and this thrower was less consistent. While in the second graphical representation, you could practically draw a line across the value bars. The graph does not show much variation.
1b. Was your first impression correct? Explain.
Upon closer examination, students might discover that this first notion is incorrect, the graphs are misleading. The first thrower had a range of 87 to 89, while the second thrower’s distances range from about 85 to 89. Students were misled because of the scale. For one, the second graph starts at 0, making the bars much longer and it appears that they are closer together. With an interval of 10, it is hard to see the variation. The first graph on the other hand zooms into the values between 86 and 89.5. This really allows us to see the variance, and with a scale of 0.5, we can be a lot more precise.
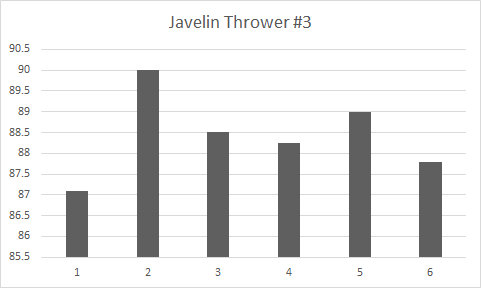
2a. Graph this data.
2b. Justify your choice of interval for the scale.
Students will likely select an interval of 1 or 0.5. Because all of the distances are so close together, the range is so small, it makes sense to highlight the small variance by zooming into the data. The smaller interval allows the reader to communicate the exact distance of each throw with more precision.
Next Moves
Consolidation
Focus today’s consolidation on the impact of the scale. Discuss how selecting the interval and whether or not to start the scale at 0 can have a significant impact on the audience’s reaction and initial notions of the results. For this reason, when we are using graphs to compare two or more data sets, it is important to use the same scale. Otherwise, the data may be misleading.
Oftentimes, the choice of interval and starting point is based on the range of the data. The range of a set of data is the difference between the highest and lowest values in the set
Student prompt:
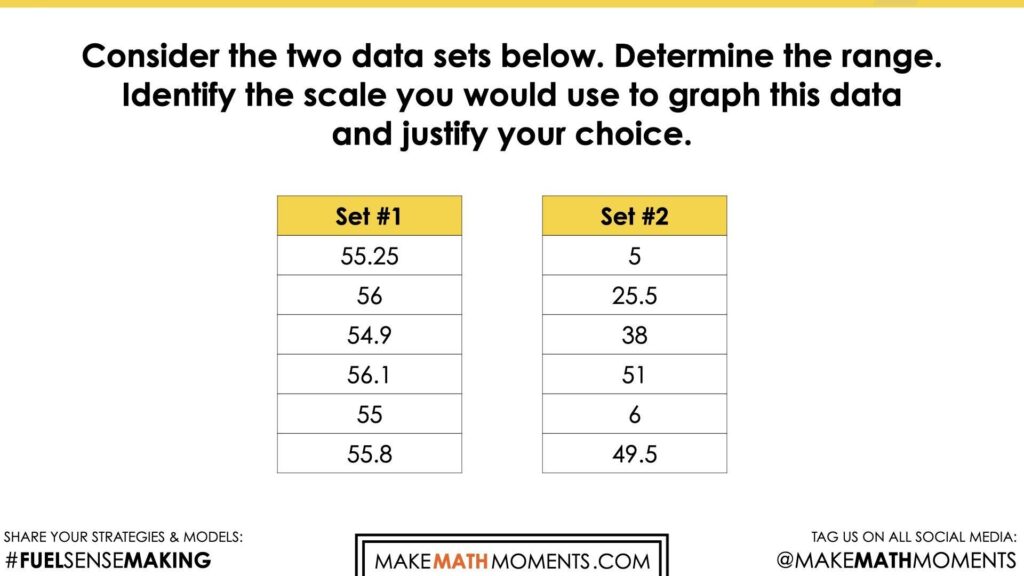
Consider the two data sets below.
Determine the range.
Identify the scale you would use to graph this data and justify your choice.
Reflect and Consolidation Prompts
Provide students an opportunity to reflect on their learning by offering these consolidation prompts to be completed independently.
Consolidation Prompt #1:
Consider the data sets below.
For each data set, determine the range. Identify the scale you would use to graph this data and justify your choice.
Consolidation Prompt #2:
When using graphical representations to compare two or more data sets, why is it important to use the same scale?
We suggest collecting this reflection as an additional opportunity to engage in the formative assessment process to inform next steps for individual students as well as how the whole class will proceed.
Resources & Downloads
Printable Lesson Plan PDF
Videos, Images & Media Files
Apple Keynote Presentation
Powerpoint Presentation
Printable Consolidation Prompts
Educator Discussion Area
Login/Join to access the entire Teacher Guide, downloadable slide decks and printable handouts for this lesson and all problem based units.
Explore Our 60+ Problem Based Units
This Make Math Moments Lesson was designed to spark curiosity for a multi-day unit of study with built in purposeful practice, number talks and extensions to elicit and emerge strategies and mathematical models.
Dig into our other units of study and view by concept continuum, grade or topic!
